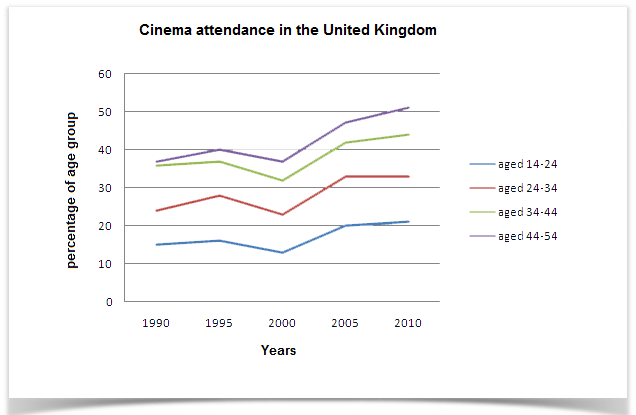
The line graph below gives information on cinema attendance in the UK.
Sample Response
The given line graph shows the number of cinema-going UK people and classifies these viewers in four age groups. As is observed from the graph, people over 40 years old went to movies more than the younger people of the UK. As is observed from the line graph, the people of 44 to 54 years-old attended cinema more than the people of other age groups who are less than 44 years old. Only 15% of the UK citizens who were between 14 to 24 years old attended in cinema in 1990 while this percentage increased with the increase of age group. In this same year, more than 35% people over 40 years attended the cinema. It is clear from the data that, the people in UK trend to attend cinema more with the increase of their age. The cinema goer’s number increased gradually from 1990 to 2010 except for 1995 to 2000. In 2010, the number of cinema attendees was also dominated by the age group of 44 to 54 and the percentage of cinema attendees from all age groups increased by 5% on an average than the percentages were in 2005.
IELTS Writing Correction
- 1. Use percentage percentage of UK people attending the cinema
- 2. More natural verb divides them
- 3. Avoid repetition More specifically,
- 4. Age adjective 44- to 54-year-olds
- 5. Range preposition between 14 and 24 years old
- 6. Preposition error attended the cinema
- 7. Add of 35% of people
- 8. Verb form people in the UK tended to attend the cinema
IELTS Writing Criteria Scores
Detailed feedback by IELTS writing criterion after the annotated essay.
Task Achievement
The response identifies the main age pattern and the general rise over time, but it repeatedly calls percentages 'numbers' and includes an inaccurate final claim about a 5% average rise from 2005 to 2010. It also gives limited exact comparison across all four age groups.
Use percentages consistently and compare the highest and lowest age groups at the start and end of the period.
Coherence and Cohesion
The answer has a clear progression from overview to details, but the first two sentences repeat the same overview and some linking is overused. There is no paragraphing in the extracted response.
Divide the response into introduction, overview, and two data-detail paragraphs, removing repeated 'As is observed' phrases.
Lexical Resource
The vocabulary is understandable but sometimes inaccurate or unnatural, such as 'number of cinema-going UK people', 'trend to attend', and 'cinema goer's number'.
Use natural chart phrases: 'cinema attendance', 'the proportion of people', 'age group', 'rose', 'dipped', and 'remained stable'.
Grammatical Range and Accuracy
Grammar is generally understandable, but there are errors with articles, prepositions, possessives, and subject-verb agreement. Several long sentences need cleaner clause control.
Rewrite long comparisons using simple accurate structures: 'The proportion for X rose from A to B, while Y increased from C to D'.