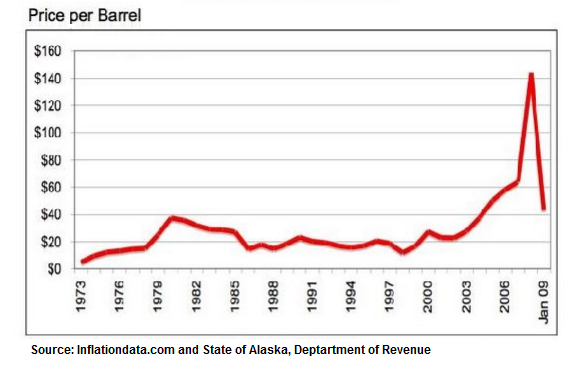
The line graph shows the historical oil prices per barrel from 1973 to January 2009.
Sample Response
The line graph illustrates the fluctuations in oil price per Barrel from 1973 to January 2009. The data sources are - inflationdata.com and the Revenue Department of Alaska. Overall, oil price per barrel was as low as 5 USD in 1973 and went as high as USD 143 in 2008 and kept on declining afterwards.
It is clear from the graph that the oil price fluctuated between 1973 and 2003 and reached a peak of approximately 145 USD per Barrel after 2006. From 1973 to 1980, the oil price increased significantly from 5 to 40 USD per Barrel. However, the price went down to about 15 USD per Barrel in 1986 and continued to fluctuate until 2003.
After 10 years of the fluctuations, interestingly enough, the price went up dramatically to as much as 60 USD per Barrel in 2007 and rocketed to roughly 142 USD, which was a peak, in around 2008, and decreased dramatically to 40 USD per Barrel in 2009.
IELTS Writing Correction
- 1. Capitalization per barrel
- 2. Dash punctuation The data sources are
- 3. Approximate peak peaked at about USD 143 in 2008
- 4. Time reference then fell sharply by January 2009
- 5. Date precision around 2008
- 6. Unit order from USD 5 to about USD 40
- 7. Add range detail continued to fluctuate at a much lower level until 2003
- 8. Unclear time link After this relatively stable period
IELTS Writing Criteria Scores
Detailed feedback by IELTS writing criterion after the annotated essay.
Task Achievement
The response gives a clear overview of the long-term fluctuation, the 2008 peak, and the sharp fall by January 2009. It selects relevant figures, though a few dates and phrases could be more precise.
Add one more comparison between the relatively stable mid-1980s to late-1990s period and the dramatic surge after 2003.
Coherence and Cohesion
Paragraphing is clear and the sequence follows the timeline well. Some cohesion is repetitive but does not block understanding.
Use more varied time links such as 'during the late 1980s', 'from the early 1990s', and 'by January 2009'.
Lexical Resource
The vocabulary is effective for line-graph description, including 'fluctuated', 'peak', 'declining', and 'rocketed'. Some capitalization and word choices are inconsistent.
Keep units consistent as 'US dollars per barrel' and avoid capitalizing 'barrel' mid-sentence.
Grammatical Range and Accuracy
Most sentences are accurate, but there are some awkward structures, especially 'After 10 years of the fluctuations' and repeated use of 'per Barrel'.
Proofread for article use, capitalization, and time-clause accuracy.