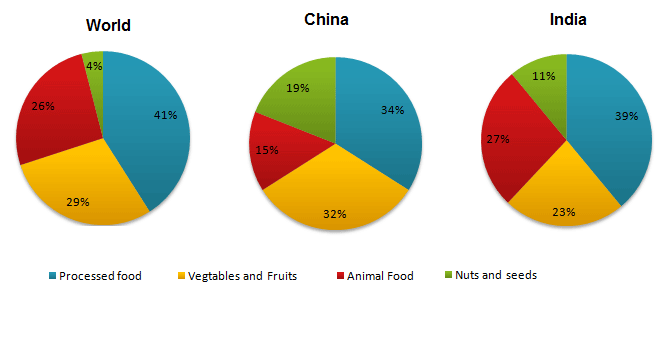
The pie charts show the average consumption of food in the world in 2008 compared to two countries; China and India.
Sample Response
The pie charts outline the types of food people ate in 2008 compared with the consumption of these items in China and India in the same year. As a general trend, processed food was the main energy source for the world population and consumption of nuts and seeds in China and India was significantly higher than the world average. As the illustration suggests, just over 40% diet of the global population came from processed food in 2008 which was slightly greater than that of India and exactly 7% higher than that of China. Vegetables and fruits provided somewhat one-third dietary requirements of the Chinese citizens and precisely 23% of Indians. The world average for fruit and vegetable consumption was just below 30%. Interestingly, nuts and seeds accounted for almost one-fifth food stocks for the Chinese, a noticeably higher rate than the world standard. Nearly one-tenth food rations in India was from nuts and seeds. Food derived from animals supplied more than one-fourth Indian dietary provisions, which was 12% higher than that of China and almost the same of the world’s dietary demands.
IELTS Writing Correction
- 1. Clearer scope proportions of four food types consumed worldwide, in China, and in India in 2008
- 2. Unsupported term largest food category
- 3. Missing of 40% of the diet
- 4. Unnatural phrase about one-third of Chinese food consumption
- 5. Avoid population label China's consumption
- 6. Wrong noun food consumption
- 7. Neutral comparison world average
- 8. Missing of one-tenth of food consumption
IELTS Writing Criteria Scores
Detailed feedback by IELTS writing criterion after the annotated essay.
Task Achievement
The response accurately identifies the main proportions across the world, China, and India, and includes useful comparisons for processed food, vegetables/fruits, nuts/seeds, and animal food. Some wording such as 'energy source' and 'food stocks' is not directly supported by the pie charts.
Keep all descriptions as shares of food consumption rather than nutrition, energy, stocks, or dietary requirements.
Coherence and Cohesion
The report is cohesive and mostly well sequenced, moving from overview to category details. It would benefit from clearer paragraphing and a more explicit comparison of India versus China for animal food.
Use one paragraph for processed food and vegetables/fruits, and another for animal food and nuts/seeds.
Lexical Resource
Lexical range is good, but several phrases are over-elaborate or imprecise for simple percentages, such as 'dietary provisions' and 'food rations'.
Use concise Task 1 nouns: 'share', 'proportion', 'category', 'accounted for', and 'made up'.
Grammatical Range and Accuracy
Grammar is generally controlled, but some noun phrases are missing articles or prepositions, and one final comparison is incomplete.
Check phrases after percentages: use 'of the diet', 'of consumption', or 'of food intake' consistently.