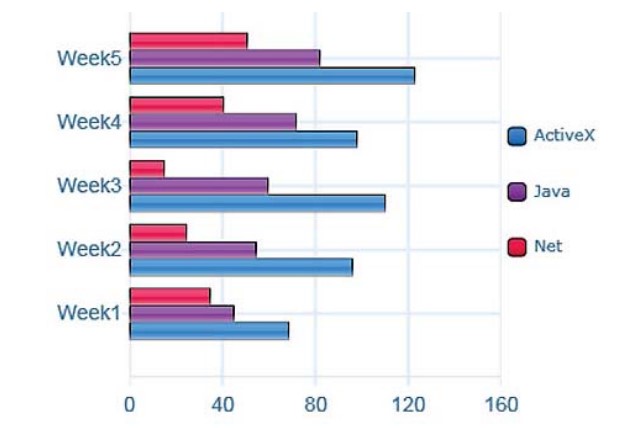
The bar chart shows the number of times per week (in 1000s), over five weeks, those three computer packages were downloaded from the internet.
Sample Response
The given bar chart represents the information regarding downloading computer packages from the internet within five weeks and data on how many times per week these packages are downloaded.
Overall, the demand for the Net package was low every week compared to others.
At a fleeting glance, it is noticeable that in the first week, the collection of active x was low, which was below 80000, but as the week passed, individuals were more excited to download active X, which was highly demandable when it went to week 5. In order to download a Java application, a little increase in difference can be seen every week for downloading this application.
Regarding the net computer package in the first two weeks, the demand was about 50000 which faced a decrease in the next two weeks with the amount of 30000 and 20000 respectively. In the fourth week downloading demand for Net Application went upward with 40000 downloads, and in the next week, this ratio began to incline.
IELTS Writing Correction
- 1. Use a direct verb Original: represents the information regarding downloading Suggested revision: shows the number of downloads of Why it matters: The replacement states the measured quantity directly and naturally.
- 2. Use time preposition Original: within Suggested revision: over Why it matters: Over is the correct preposition for data covering a five-week period.
- 3. Remove repetition Original: and data on how many times per week these packages are downloaded Suggested revision: for each package Why it matters: The original clause repeats the measurement already introduced earlier in the sentence.
- 4. Report measured data Original: demand for the Net package Suggested revision: number of Net downloads Why it matters: The chart measures downloads rather than consumer demand.
- 5. Specify comparison group Original: compared to others Suggested revision: compared with the other two packages Why it matters: The definite phrase clearly identifies the two remaining series.
- 6. Use neutral framing Original: At a fleeting glance Suggested revision: Looking at the details Why it matters: Fleeting glance is informal and suggests insufficient examination of the chart.
- 7. Name the series Original: collection of active x Suggested revision: number of ActiveX downloads Why it matters: This wording accurately names both the package and the quantity measured.
- 8. Correct week-one value Original: below 80000 Suggested revision: about 70,000 Why it matters: The ActiveX bar for week 1 is approximately 70,000 downloads.
- 9. Use plural time Original: week Suggested revision: weeks Why it matters: The trend develops across several weeks, so the plural form is required.
- 10. Avoid inferred motivation Original: individuals were more excited to download active X Suggested revision: ActiveX downloads generally increased Why it matters: The chart shows download totals but gives no information about users' emotions or motivation.
- 11. Use natural wording Original: highly demandable Suggested revision: in greatest demand Why it matters: Demandable is not natural vocabulary for describing the most frequently downloaded package.
- 12. Clarify the endpoint Original: when it went to week 5 Suggested revision: by week 5 Why it matters: By week 5 expresses the endpoint of the trend concisely and grammatically.
Suggested Rewrites
- represents the information regarding downloading shows the number of downloads of
- within over
- and data on how many times per week these packages are downloaded for each package
- demand for the Net package number of Net downloads
- compared to others compared with the other two packages
- At a fleeting glance Looking at the details
Why this response received Band 5.5
The response is organised by package and correctly recognises that Net remained the least downloaded, while also noting the broad rise in Java and ActiveX. However, several Net figures are inaccurate or internally contradictory, and the overview omits the dominant position of ActiveX. The highest-priority improvement is to verify each weekly value against the chart and summarise the main ranking and overall trends before adding detail.
IELTS Writing Criteria Scores
Task Achievement
The response identifies some broad trends, but its overview is incomplete and several reported Net values conflict with the chart and with one another.
State that ActiveX was highest throughout, then report the Net sequence accurately at roughly 35, 25, 15, 40, and 50 thousand.
Coherence and Cohesion
Paragraphing by general trend and package provides a visible structure, although vague referencing and contradictory week-four information weaken progression.
Describe each package in chronological order and avoid giving two different values for the same week.
Lexical Resource
There is some relevant trend vocabulary, but frequent unnatural combinations such as collection of ActiveX, highly demandable, and ratio reduce precision.
Use standard chart language such as downloads, rose, dipped, remained the lowest, and reached a peak.
Grammatical Range and Accuracy
Meaning is generally recoverable and some complex sentences are attempted, but article, agreement, clause, and tense errors occur repeatedly.
Use shorter controlled sentences with a clear subject and verb, especially when comparing values across consecutive weeks.
Write this task while it is fresh
Try the same task now. It helps you remember the feedback and write better next time.
IELTS Academic Writing Task 1
The bar chart shows the number of times per week (in 1000s), over five weeks, those three computer packages were downloaded from the internet.
Your response
Write the task yourself, then compare your choices with the annotated response.