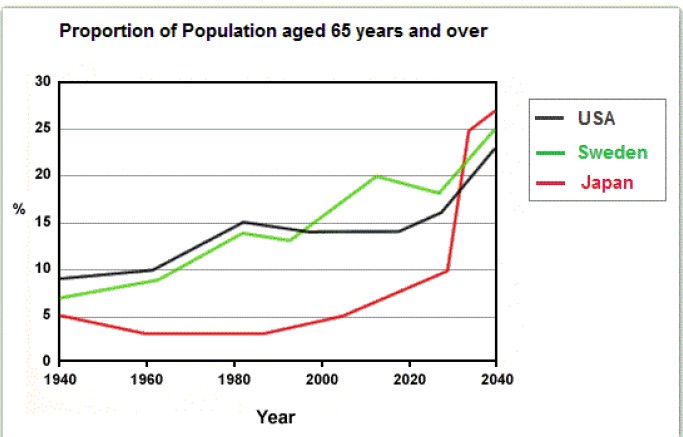
The graph below shows the proportion of the population aged 65 and over between 1940 and 2040 in three different countries.
Sample Response
The graph illustrates the percentage of people older than 65 or older in three countries, namely the United States of America, Sweden, and Japan, from 1940 to2040.
In 1940, the contribution of old citizens aged 65 or above in the United States of America and Sweden was around 8% and 60%, respectively. Sweden’s percentage increased and remained steady between 1980 and 1990. From 2000 to 2014, it experienced fluctuations; however, it reached 25% at the end of the period. Whereas the United States raised 15% in 1960. During 1980 20-20, it also remained stable same as Sweden. After that, the proportion of the old person was almost 20% in 2040, and both the countries exceeded in 2020.
Turning to Japan, it slightly declined from 1940 to 1960. After this, it remained balanced between 1960 and 1980. In 2020, it dramatically skyrocketed by 16% in approximately 2030. It also collapsed with other countries like the United States and Sweden. In the end period, it grew around 27% in 2040.
Overall, the percentile of the three nations’ PLD citizens showed a steady trend but significantly rose over the period, while Japan depicts a minor change at the starting point.
IELTS Writing Correction
- 1. Remove redundant wording Original: older than 65 or older Suggested revision: aged 65 or over Why it matters: This standard phrase expresses the age group clearly without repetition.
- 2. Use proportion Original: contribution of old citizens Suggested revision: proportion of older people Why it matters: Contribution does not describe the percentage of a population group.
- 3. Correct Sweden figure Original: 60 Suggested revision: 7 Why it matters: The graph shows Sweden at approximately 7% in 1940.
- 4. Correct Sweden trend Original: increased and remained steady between 1980 and 1990 Suggested revision: fell slightly between 1980 and 1990 Why it matters: Sweden declines from about 14% to roughly 13% over this interval.
- 5. Clarify time range Original: During 1980 20-20 Suggested revision: From 1980 to 2020 Why it matters: The replacement gives the intended period in a grammatically clear form.
- 6. Correct comparison Original: remained stable same as Sweden Suggested revision: remained stable, unlike Sweden Why it matters: The USA stays near 14% while Sweden changes noticeably during this period.
- 7. Fix noun phrase Original: proportion of the old person Suggested revision: proportion of older people Why it matters: A plural count noun is needed to refer to this population group generally.
- 8. State crossover clearly Original: both the countries exceeded in 2020 Suggested revision: Japan overtook both countries after 2030 Why it matters: The graph shows Japan surpassing the USA and Sweden only after its sharp rise in the 2030s.
- 9. Use trend vocabulary Original: balanced Suggested revision: stable Why it matters: Stable accurately describes an unchanged percentage over time.
- 10. Correct Japan comparison Original: collapsed with other countries like the United States and Sweden Suggested revision: surpassed the other two countries Why it matters: Japan rises above both other countries rather than collapsing with them.
- 11. Use natural phrase Original: In the end period Suggested revision: At the end of the period Why it matters: This is the standard expression for referring to the final year.
- 12. Describe final value Original: grew Suggested revision: reached Why it matters: Reached identifies an end value, whereas grew would describe the amount of change.
Suggested Rewrites
- older than 65 or older aged 65 or over
- contribution of old citizens proportion of older people
- 60 7
- increased and remained steady between 1980 and 1990 fell slightly between 1980 and 1990
- During 1980 20-20 From 1980 to 2020
- remained stable same as Sweden remained stable, unlike Sweden
Why this response received Band 5.0
The response is strongest when tracing Japan’s early decline and late surge, and it provides a recognizable country-by-country structure. Its main limitation is inaccurate and unclear reporting, including Sweden at 60% in 1940 and the USA at 15% in 1960, alongside a weak overview. Prioritize checking every figure against the graph and stating the main cross-country trends and final ranking accurately.
IELTS Writing Criteria Scores
Task Achievement
The response addresses all three countries and notes some trends, but major inaccurate figures and a vague overview weaken task coverage.
Verify each value against the graph and summarize the overall rises, Japan’s late surge, and the countries’ final ranking.
Coherence and Cohesion
The country-based paragraphs provide basic progression, although awkward linking and unclear time references disrupt the flow.
Organize each country’s changes chronologically and connect complete sentences with simple, accurate linking phrases.
Lexical Resource
Some trend vocabulary is attempted, but frequent inaccurate choices such as contribution, percentile, and collapsed reduce precision.
Use standard graph language such as proportion, rose, remained stable, surpassed, and reached with the correct grammatical patterns.
Grammatical Range and Accuracy
A mixture of sentence forms is attempted, but frequent agreement, article, tense, and clause errors sometimes obscure meaning.
Prioritize complete subject-verb sentences and check tense, articles, and singular-plural agreement throughout.
Write this task while it is fresh
Try the same task now. It helps you remember the feedback and write better next time.
IELTS Academic Writing Task 1
The graph below shows the proportion of the population aged 65 and over between 1940 and 2040 in three different countries.
Your response
Write the task yourself, then compare your choices with the annotated response.