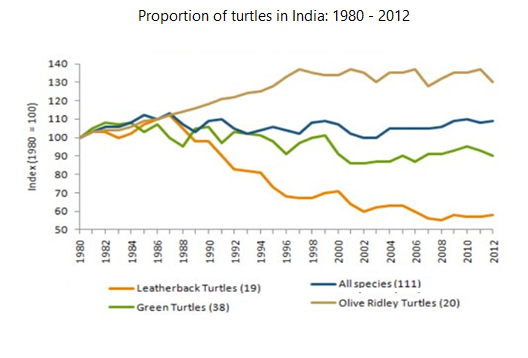
The graph below gives information on the population of turtles in India from 1980 to 2012.
Sample Response
The given line graph illustrates the number of population of four various kinds of turtles in India between 1980 and 2012. The unit is measured in Index. It can be clearly seen from the graph that the number of Olive Ridley turtles soared within the given period of time and the figure of Leatherback Turtles gradually plummeted across the given period.
To begin with, in the year 1980 the number different turtle population represented the same figure (100). After that, the number of Leatherback progressively rose up and reached to above 130 in the year 1997. Thereafter it showed fluctuations and presented the figure of the population to 130 during the year 2012.
Similarly, all species showed gradual increase till 1987 (110) and following that depicted oscillation and hit figure almost 110. Green Turtles showed a downward trend. The number of Green turtles palpitated throughout the given period and the population figure reached almost 95 in the year 1989.The number of Olive Ridley Turtles presented sharp increase till 1987(110) and thereafter showed sharp decline throughout the given years and reached its number to below 60 in the year 2012, which is the least number of the population showed among turtles.
IELTS Writing Correction
- 1. Use count noun Original: the number of population Suggested revision: the populations Why it matters: Population should be plural when referring to four separate turtle groups.
- 2. Use precise term Original: four various kinds Suggested revision: four species Why it matters: Species is the concise and accurate term for the categories in the graph.
- 3. Describe the index Original: unit is measured in Index Suggested revision: figures are expressed as an index (1980 = 100) Why it matters: Figures, rather than a unit, are expressed as an index.
- 4. Repair noun phrase Original: the number different turtle population Suggested revision: the populations of the different turtle species Why it matters: The phrase needs of and plural nouns to be grammatical.
- 5. Use index wording Original: represented the same figure (100) Suggested revision: had the same index value of 100 Why it matters: Species had an index value rather than representing a figure.
- 6. Correct the species Original: the number of Leatherback Suggested revision: the Olive Ridley index Why it matters: The series that rises above 130 is Olive Ridley, not Leatherback.
- 7. Remove redundancy Original: rose up Suggested revision: rose Why it matters: Rose already expresses upward movement, so up is redundant.
- 8. Remove extra preposition Original: reached to above 130 Suggested revision: reached over 130 Why it matters: Reach takes its value directly without to.
- 9. Use natural reporting Original: presented the figure of the population to 130 Suggested revision: ended at an index of about 130 Why it matters: The replacement reports the final index clearly and naturally.
- 10. Use concise time phrase Original: during the year 2012 Suggested revision: in 2012 Why it matters: In 2012 is the conventional concise form for a single year.
- 11. Identify aggregate series Original: Similarly, all species Suggested revision: For the overall series, the index Why it matters: Similarly does not show that this sentence shifts to the separate all-species line.
- 12. Avoid species conflation Original: showed gradual increase till 1987 (110) Suggested revision: rose gradually to about 110 by 1987 Why it matters: The value refers to the aggregate all-species line, not to every individual species.
Suggested Rewrites
- the number of population the populations
- four various kinds four species
- unit is measured in Index figures are expressed as an index (1980 = 100)
- the number different turtle population the populations of the different turtle species
- represented the same figure (100) had the same index value of 100
- the number of Leatherback the Olive Ridley index
Why this response received Band 5.5
The response has a clear paragraph structure and identifies the two most important overall trends correctly. However, the body reverses those trends, describing Leatherback turtles as rising to around 130 and Olive Ridley turtles as falling below 60, while the graph shows the opposite; several other series are only vaguely covered. Rebuild the detail paragraphs directly from each labelled line, checking species names and end values before drafting.
IELTS Writing Criteria Scores
Task Achievement
The overview identifies the correct principal trends, but the detailed account reverses the Leatherback and Olive Ridley series and gives limited accurate coverage of the others.
Match each species name to its line and report that Olive Ridley rises to about 130 while Leatherback falls below 60.
Coherence and Cohesion
The response is organised into a clear introduction and detail paragraphs, although mechanical linking and conflicting statements weaken progression.
Group the two rising or stable series separately from the declining series and use precise references to each species.
Lexical Resource
There is some range in trend vocabulary, but frequent inappropriate collocations such as number of population, palpitated, and reached its number reduce precision.
Use standard graph language such as population index, fluctuated, rose to, and fell to throughout.
Grammatical Range and Accuracy
A mixture of simple and complex sentences is attempted, but frequent article, preposition, agreement, and word-form errors reduce accuracy.
Practise complete comparison structures and remove nonstandard forms such as reached to and the number different turtle population.
Write this task while it is fresh
Try the same task now. It helps you remember the feedback and write better next time.
IELTS Academic Writing Task 1
The graph below gives information on the population of turtles in India from 1980 to 2012.
Your response
Write the task yourself, then compare your choices with the annotated response.