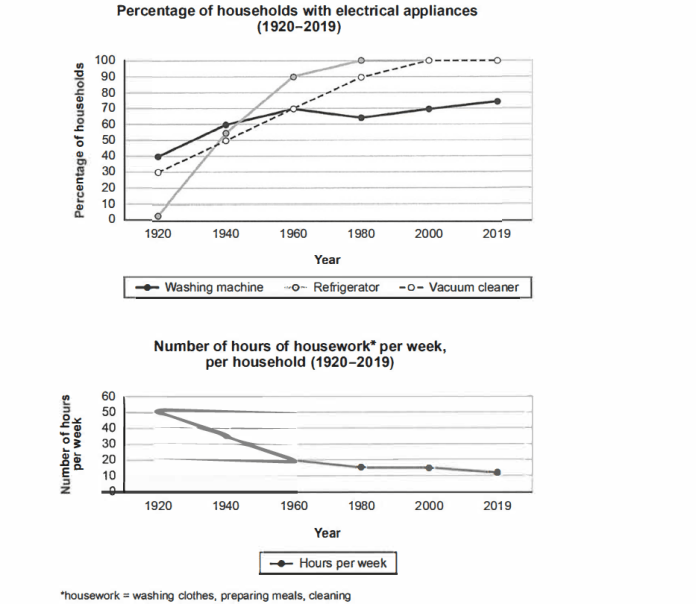
The charts below show the changes in ownership of electrical appliances and amount of time spent doing housework in households in one country between 1920 and 2019.
Sample Response
The first graph displays the percentages of households that owned electrical appliances in one country between 1920 and 2019, while the second graph illustrates how much time households in that country spent doing housework during the same period.
Overall, ownership of all three appliances increased during this period, with that of refrigerators having the greatest growth. At the same time, the amount of time spent on housework decreased.
Washing machines were the most common of the three electrical appliances in 1920, with ownership reaching 40% of the population. This number then rose to about 75% in 2019, with a small dip in 1980. Nearly a third of households owned vacuum cleaners in 1920. Although ownership climbed steadily, it did not reach 100% until 2000.
In comparison, almost no households had a refrigerator in 1920. However, ownership increased rapidly and by 1980 there was one in every household.
The amount of time spent doing housework, by contrast, first fell significantly from 50 to 15 hours per week between 1920 and 1980. After that, it only experienced a small drop to just over 10 hours a week in 2019.
IELTS Writing Correction
- 1. Clarify chart measure Original: percentages of households that owned electrical appliances Suggested revision: percentage of households owning each electrical appliance Why it matters: The singular measure plus each makes clear that the graph tracks three separate appliances.
- 2. Use concise comparison Original: with that of refrigerators having the greatest growth Suggested revision: with refrigerator ownership showing the greatest increase Why it matters: This wording states the comparison more directly and precisely.
- 3. Use correct denominator Original: 40% of the population Suggested revision: 40% of households Why it matters: The graph measures households rather than individual people in the population.
- 4. Refer to data clearly Original: number Suggested revision: figure Why it matters: Figure is the more precise reference to a percentage shown on a chart.
- 5. Report exact value Original: Nearly a third Suggested revision: Thirty per cent Why it matters: The chart gives an exact 30% value for vacuum-cleaner ownership in 1920.
- 6. Correct final value Original: just over 10 hours a week Suggested revision: 10 hours per week Why it matters: The 2019 point is shown at 10 hours, not above 10.
- 7. Sentence rewrite Original: Although ownership climbed steadily, it did not reach 100% until 2000. Suggested revision: Vacuum-cleaner ownership climbed steadily and reached 100% in 2000. Why it matters: Naming the appliance removes an avoidable ambiguity and states the endpoint directly.
- 8. Sentence rewrite Original: However, ownership increased rapidly and by 1980 there was one in every household. Suggested revision: However, refrigerator ownership increased rapidly, reaching 100% in 1980. Why it matters: The rewrite identifies the appliance and reports the chart's percentage measure precisely.
Suggested Rewrites
- percentages of households that owned electrical appliances percentage of households owning each electrical appliance
- with that of refrigerators having the greatest growth with refrigerator ownership showing the greatest increase
- 40% of the population 40% of households
- number figure
- Nearly a third Thirty per cent
- just over 10 hours a week 10 hours per week
Why this response received Band 8.5
The response is strongest in its clear overview and accurate selection of the main appliance and housework trends, supported by well-chosen figures and logical grouping. Its main limitation is a small loss of precision, especially describing household ownership as a percentage of the population and the final housework figure as just over 10 hours; prioritise exact units and values throughout.
IELTS Writing Criteria Scores
Task Achievement
A clear overview and accurate supporting figures cover all principal trends, with only minor imprecision in the unit for washing-machine ownership and the 2019 housework value.
Keep every figure tied to the chart’s exact unit—percentage of households or hours per household—and report the final value as 10 hours.
Coherence and Cohesion
Information progresses smoothly from the overview to appliance-specific trends and then housework, with cohesive comparisons and purposeful paragraphing.
For an even tighter report, combine the short refrigerator paragraph with the other appliance details while preserving the clear comparison.
Lexical Resource
Vocabulary is varied and precise for trends and comparisons, with natural phrases such as ‘climbed steadily’ and ‘in comparison’.
Refine the remaining unit language by replacing ‘40% of the population’ with ‘40% of households’.
Grammatical Range and Accuracy
A wide range of complex sentence structures is used accurately and flexibly, with virtually no grammatical disruption.
Maintain this control while continuing to vary comparative structures and avoid any ambiguity in pronoun reference.
Write this task while it is fresh
Try the same task now. It helps you remember the feedback and write better next time.
IELTS Academic Writing Task 1
The charts below show the changes in ownership of electrical appliances and amount of time spent doing housework in households in one country between 1920 and 2019.
Your response
Write the task yourself, then compare your choices with the annotated response.