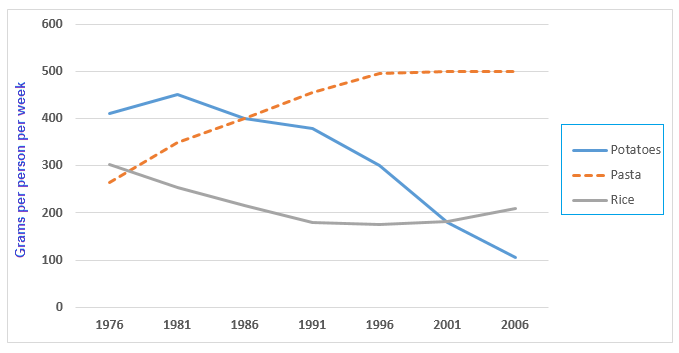
The graph below shows the amount in grams of potatoes, pasta and rice eaten in a European country between 1976 and 2006.
Sample Response
The line graph presents information on weekly potato, pasta and rice consumption per person in a European country over a period of 30 years, commencing from 1976, measured in grams. Overall, the consumption of potatoes and rice declined over the time while pasta intake increased significantly. Now getting back to the details, initial consumption of potatoes was over 400 grams per person in a week while it was roughly 300 grams for rice and pasta. The amount of pasta consumption rose gradually from 1976 to 1996 and remained steady to reach the peak in 2006 approximately at 500 grams per person in a week. In contrast, the intake of potatoes showed a fluctuation between 1976 and 1996. Furthermore, potatoes intake reached the nadir about 100 grams per person per week in 2006. It can be clearly seen that the rice consumption fluctuated from 1976 to 1996 and then the consumption of that dropped moderately. However, from 2001 to 2006 there was a rising of rice consumption in a European country. During the period its consumption dropped from 300 grams to just over 200 grams.
IELTS Writing Correction
- 1. Clarify time range Original: over a period of 30 years, commencing from 1976 Suggested revision: from 1976 to 2006 Why it matters: The replacement states both endpoints directly and removes the awkward use of "commencing from".
- 2. Remove extra article Original: over the time Suggested revision: over time Why it matters: The fixed expression for a general trend is "over time" without an article.
- 3. Use formal transition Original: Now getting back to the details Suggested revision: Turning to the details Why it matters: This transition is more concise and appropriate for a formal chart report.
- 4. Name the start year Original: initial consumption of potatoes Suggested revision: potato consumption in 1976 Why it matters: Naming the year makes the starting comparison more precise.
- 5. Fix weekly expression Original: in a week while Suggested revision: per week, while Why it matters: "Per week" is the natural rate expression and the comma separates the comparison.
- 6. Remove wordiness Original: The amount of pasta consumption Suggested revision: Pasta consumption Why it matters: The original phrase is an unnecessary and unnatural nominal construction.
- 7. Clarify final trend Original: remained steady to reach the peak Suggested revision: then levelled off, reaching a peak Why it matters: This wording accurately links the rise to the later plateau near 500 grams.
- 8. Correct word order Original: approximately at 500 grams Suggested revision: at approximately 500 grams Why it matters: The approximator should follow the preposition in this measurement phrase.
- 9. Signal the endpoint Original: Furthermore Suggested revision: By 2006 Why it matters: A time marker connects the sentence directly to the final data point.
- 10. Use singular modifier Original: potatoes Suggested revision: potato Why it matters: A singular noun is needed when "potato" modifies "intake".
- 11. Use natural low point Original: reached the nadir about 100 grams Suggested revision: reached a low of about 100 grams Why it matters: The revised phrase uses the correct preposition and a natural chart-reporting expression.
- 12. Use active trend verb Original: there was a rising of rice consumption Suggested revision: rice consumption rose Why it matters: "A rising of" is not the correct noun construction for this trend.
Suggested Rewrites
- over a period of 30 years, commencing from 1976 from 1976 to 2006
- over the time over time
- Now getting back to the details Turning to the details
- initial consumption of potatoes potato consumption in 1976
- in a week while per week, while
- The amount of pasta consumption Pasta consumption
Why this response received Band 6.5
The response gives a clear overview of the three trends and accurately identifies the major starting and ending figures, especially the rise in pasta and fall in potatoes. Its main weakness is imprecise treatment of the rice pattern, which mostly declined until 1996 before recovering, together with several awkward expressions. The priority is to describe each line chronologically with precise turning points and more natural chart-reporting language.
IELTS Writing Criteria Scores
Task Achievement
The overview and most key figures are accurate, but the mainly downward rice trend to 1996 is loosely described as fluctuation.
Trace each series through its major turning points and distinguish sustained movement from genuine fluctuation.
Coherence and Cohesion
The account follows a generally logical sequence, although the rice discussion becomes repetitive and slightly contradictory within one undivided paragraph.
Use separate overview and detail paragraphs, grouping the two declining foods before contrasting them with pasta.
Lexical Resource
There is sufficient range for trends and extremes, but phrases such as "consumption of that" and "a rising" lack natural precision.
Use established combinations such as "rice consumption rose" and "reached a low of" consistently.
Grammatical Range and Accuracy
Both simple and complex forms convey meaning clearly, though article, noun-form and preposition errors recur across the response.
Proofread constructions such as "potato intake", "a rise" and "reached a low of 100 grams" for accurate form.
Write this task while it is fresh
Try the same task now. It helps you remember the feedback and write better next time.
IELTS Academic Writing Task 1
The graph below shows the amount in grams of potatoes, pasta and rice eaten in a European country between 1976 and 2006.
Your response
Write the task yourself, then compare your choices with the annotated response.