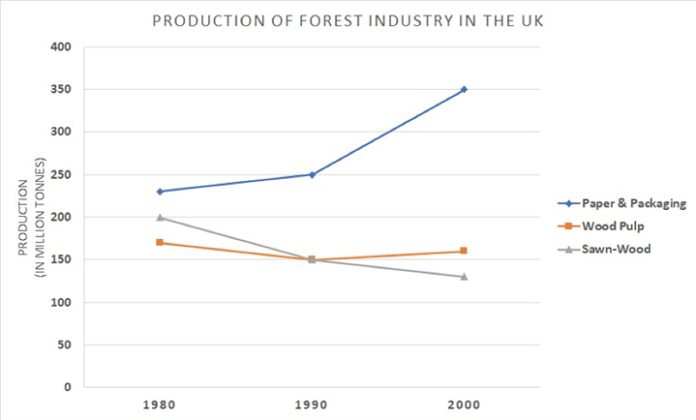
Line graph The line graph below shows the production of paper, wood pulp and sawn-wood in the UK from 1980 to 2000.
Sample Response
The line graph illustrates the production of forest-based industry in the UK between 1980 and 2000.
Overall, it can be seen from the graph that the production of paper and packaging experienced a significant increase during the 20-year period, while the opposite pattern was true for the production of sawn-wood and wood pulp. And also, the manufacture of paper and packaging had the greatest position among the three mentioned ones.
In the first ten years, the amount of paper and packaging produced slightly went up, from 230 to 250 million tonnes. Thereafter, the figure suddenly climbed to 350 million tonnes, which is almost one-and-a-half greater than the former number.
However, the story was different when it comes to the production of sawn-wood and wood pulp. Starting at 200 million tonnes in 1980, the amount of sawn-wood product saw a gradual decrease to 150 million tonnes by 1990 and continued to fall to only 130 in the next ten years. The pattern of wood pulp’ production is more complex. The figure fell from 175 to 150 million tonnes by 1980, whereas in the remaining period, it recovered and increased to 170 million tonnes.
IELTS Writing Correction
- 1. Name the products precisely Original: production of forest-based industry Suggested revision: production of three forest-industry products Why it matters: The chart measures three products rather than an industry as a single output.
- 2. Correct adverb position Original: slightly went up Suggested revision: went up slightly Why it matters: The adverb naturally follows the phrasal verb in this clause.
- 3. Correct the comparison Original: almost one-and-a-half greater than the former number Suggested revision: 100 million tonnes higher than the previous figure Why it matters: The increase from 250 to 350 million tonnes is 100 million tonnes.
- 4. Use a direct contrast Original: However, the story was different when it comes to the production of Suggested revision: By contrast, production declined overall for Why it matters: This creates a concise formal transition to the two declining series.
- 5. Correct the noun phrase Original: amount of sawn-wood product Suggested revision: production of sawn wood Why it matters: The revision uses the correct uncountable production phrase.
- 6. Include the unit Original: only 130 in the next ten years Suggested revision: only 130 million tonnes in the next ten years Why it matters: The final sawn-wood figure needs its measurement unit.
- 7. Remove faulty possessive Original: wood pulp’ production Suggested revision: wood-pulp production Why it matters: The original apostrophe forms an incorrect possessive.
- 8. Correct the final value Original: whereas in the remaining period, it recovered and increased to 170 million tonnes Suggested revision: whereas over the following decade, it recovered to 160 million tonnes Why it matters: The chart shows wood-pulp production ending at 160 million tonnes in 2000.
- 9. Use time-series phrasing Original: between 1980 and 2000 Suggested revision: from 1980 to 2000 Why it matters: From and to state the chart's start and end years more directly.
- 10. Remove empty framing Original: it can be seen from the graph that Suggested revision: Delete Why it matters: The clause adds no information and delays the overview's main trend.
- 11. Use a direct verb Original: experienced a significant increase Suggested revision: increased significantly Why it matters: The direct verb is more concise while preserving the trend.
- 12. State the declines directly Original: while the opposite pattern was true for the production of sawn-wood and wood pulp Suggested revision: while sawn-wood and wood-pulp production declined overall Why it matters: The revision identifies the direction of both series explicitly.
Suggested Rewrites
- production of forest-based industry production of three forest-industry products
- slightly went up went up slightly
- almost one-and-a-half greater than the former number 100 million tonnes higher than the previous figure
- However, the story was different when it comes to the production of By contrast, production declined overall for
- amount of sawn-wood product production of sawn wood
- only 130 in the next ten years only 130 million tonnes in the next ten years
Why this response received Band 7.0
The response presents a clear overview, organises the three products effectively, and selects the principal changes with generally accurate figures. Its main limitation is imprecision in the wood-pulp account, including the mistaken date for its low point and an inaccurate final value, while several collocations are awkward. Prioritise checking each series against the graph and expressing comparisons in more natural academic language.
IELTS Writing Criteria Scores
Task Achievement
The main trends and most values are accurately reported, but the wood-pulp low point is assigned to the wrong year and its final figure is overstated.
Check the wood-pulp series carefully and report its fall to 150 million tonnes in 1990 followed by a recovery to about 160 million in 2000.
Coherence and Cohesion
The overview and product-based detail paragraphs create clear progression, though a few linking expressions are conversational or slightly mechanical.
Use direct comparative transitions and integrate the final two series without phrases such as ‘the story was different.’
Lexical Resource
There is a useful range of trend vocabulary, but several collocations, including ‘greatest position’ and ‘one-and-a-half greater,’ are imprecise.
Choose conventional expressions such as ‘remained the highest’ and ‘rose to roughly one and a half times its initial level.’
Grammatical Range and Accuracy
The response uses varied sentence structures with generally clear meaning, but recurring article, possessive, agreement, and phrasing errors reduce accuracy.
Proofread noun phrases and possessives, and keep grammatical structures concise when comparing values across years.
Write this task while it is fresh
Try the same task now. It helps you remember the feedback and write better next time.
IELTS Academic Writing Task 1
Line graph The line graph below shows the production of paper, wood pulp and sawn-wood in the UK from 1980 to 2000.
Your response
Write the task yourself, then compare your choices with the annotated response.