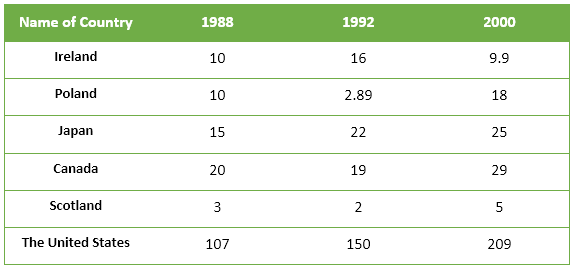
The table shows the amount of total waste produced in million tonnes in six different countries in three years.
Sample Response
The table shows the amount of waste produced by six countries in three different years. It is obvious that waste produced by the USA was far greater than that of other countries and Scotland contributed to the least amount of wastages in the given years. According to the table data, Ireland produced 16 million tonnes leftover in 1992 which was 6 million tonnes higher than that of 8 years ago. Poland’s production of garbage decreased considerably in 1992 than its initial 10 million tonnes in 1988. Japan and Canada generated 22 and 19 million tonnes garbage respectively in 1992 compared to their 15 and 20 million tonnes in 1988. Scotland’s production of waste was the lowest in the given years and stood at 2 million tonnes in 1992. The USA alone produced 150 million tonnes garbage which was overwhelmingly higher than that of other countries. Waste production in this country upsurged to 209 million tonnes after eight years when Canada and Japan’s figures stood at 29 and 25 respectively. Waste production in 2000 indicates that the USA alone produced more leftovers than the cumulative production of rest of the countries.
IELTS Writing Correction
- 1. Correct waste phrasing Original: contributed to the least amount of wastages Suggested revision: produced the least waste Why it matters: Waste is uncountable here, and countries produce rather than contribute to it.
- 2. Use from comparison Original: decreased considerably in 1992 than Suggested revision: fell considerably in 1992 from Why it matters: A fall is compared with its starting value using from rather than than.
- 3. Add of waste Original: 22 and 19 million tonnes garbage Suggested revision: 22 and 19 million tonnes of waste Why it matters: The measurement requires of before the substance being measured.
- 4. Clarify paired figures Original: their 15 and 20 million tonnes Suggested revision: 15 and 20 million tonnes respectively Why it matters: Respectively makes the two earlier figures map clearly to Japan and Canada.
- 5. State all three years Original: lowest in the given years Suggested revision: lowest in all three years Why it matters: The table confirms that Scotland had the smallest figure in each listed year.
- 6. Add of waste Original: 150 million tonnes garbage Suggested revision: 150 million tonnes of waste Why it matters: The quantity needs of before the material noun waste.
- 7. Use natural comparison Original: overwhelmingly Suggested revision: far Why it matters: This is the standard concise expression for a large numerical difference.
- 8. Use standard trend verb Original: upsurged Suggested revision: rose Why it matters: Upsurge is normally a noun, while rose is the correct verb for the increase.
- 9. Clarify time link Original: after eight years when Suggested revision: by 2000, while Why it matters: The revision identifies the endpoint and correctly links the simultaneous comparisons.
- 10. Include the unit Original: 29 and 25 respectively Suggested revision: 29 and 25 million tonnes respectively Why it matters: The two figures require their unit to be complete and unambiguous.
- 11. Use formal term Original: leftovers Suggested revision: waste Why it matters: Leftovers is imprecise for the total national waste measured in the table.
- 12. Use combined total Original: cumulative Suggested revision: combined Why it matters: Combined accurately describes adding the other countries' figures for one year.
Suggested Rewrites
- contributed to the least amount of wastages produced the least waste
- decreased considerably in 1992 than fell considerably in 1992 from
- 22 and 19 million tonnes garbage 22 and 19 million tonnes of waste
- their 15 and 20 million tonnes 15 and 20 million tonnes respectively
- lowest in the given years lowest in all three years
- 150 million tonnes garbage 150 million tonnes of waste
Why this response received Band 6.5
The response identifies the dominant US figures and Scotland’s consistently low waste output, and it includes several accurate cross-country comparisons. Its main limitation is uneven selection across the three years, compounded by the incorrect statement that 1988 was eight years before 1992. Prioritise organising the data by overall patterns and checking every time reference, while using more precise countable and uncountable nouns.
IELTS Writing Criteria Scores
Task Achievement
The overview captures the most prominent contrast and most cited figures are accurate, but several countries’ 2000 changes are omitted and one interval is misstated.
Compare the full three-year trajectories, especially the reversals for Ireland and Poland, and verify every interval.
Coherence and Cohesion
The sequence is broadly understandable, but presenting the entire report as one paragraph weakens grouping and makes the progression less controlled.
Separate the overview from two grouped detail paragraphs organised around the United States and the five lower-producing countries.
Lexical Resource
There is a useful range of comparative and trend language, although words such as "wastages", "leftover", and "upsurged" are imprecise here.
Use accurate data-reporting collocations such as "waste output", "rose to", and "fell to".
Grammatical Range and Accuracy
The response uses varied sentence structures with generally clear meaning, despite recurring article, preposition, and uncountable-noun errors.
Check noun phrases carefully, especially "tonnes of waste", "the rest of the countries", and comparative structures.
Write this task while it is fresh
Try the same task now. It helps you remember the feedback and write better next time.
IELTS Academic Writing Task 1
The table shows the amount of total waste produced in million tonnes in six different countries in three years.
Your response
Write the task yourself, then compare your choices with the annotated response.