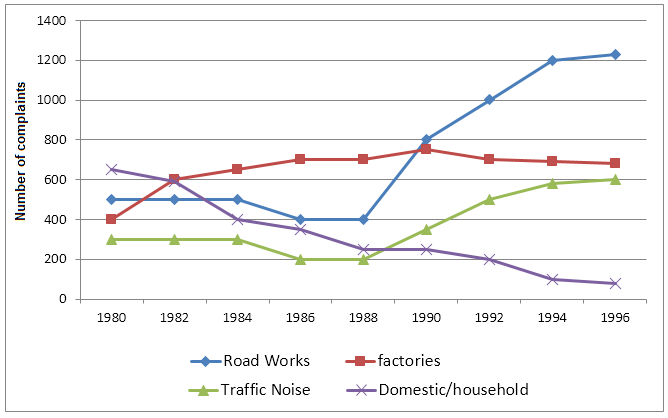
The graph below shows the number of complaints made about noise to Environmental Health authorities in the city of Newtown between 1980 and 1996.
Sample Response
The line graph shows the number of complaints received by the Environmental Health Department according to the type of noises heard in the city of Newtown. Overall, the number of complaints lodged about four noise sources increased over the period except for domestic noise, which, in fact, declined. The four types of commotions the authorities have received the most complaints about are 'road works', 'traffic noise', 'factories' and 'domestic or household disturbances'. In 1980, the authorities received over 600 complaints concerning domestic disturbances which have steadily decreased over the years. Factory noise was also on a steady increase from 1980 till it stabilised between 600 and 800 complaints per year from 1986 onwards. The two most noise complaints the authorities have received are from road works and traffic noise as both have either doubled or tripled from 1980 onwards. Noise complaints from residents in Newtown had steadily increased and reached to highest in 1986 with around 2600 complaints.
IELTS Writing Correction
- 1. Match task wording Original: Department Suggested revision: authorities Why it matters: This matches the body named in the task prompt.
- 2. Use uncountable noise Original: type of noises Suggested revision: types of noise Why it matters: Noise is uncountable when referring generally to sound categories.
- 3. Remove needless aside Original: which, in fact, declined Suggested revision: which declined Why it matters: The parenthetical phrase interrupts an otherwise clear overview.
- 4. Use precise category Original: commotions Suggested revision: noise Why it matters: Commotions does not accurately describe the four noise sources.
- 5. Avoid false ranking Original: authorities have received the most complaints about Suggested revision: authorities received complaints about Why it matters: The sentence lists all four categories, not only those attracting the most complaints.
- 6. Name noise source Original: 'factories' Suggested revision: 'factory noise' Why it matters: This label makes clear that complaints concern noise rather than factories themselves.
- 7. Match chart label Original: 'domestic or household disturbances' Suggested revision: 'domestic/household noise' Why it matters: This is the category wording shown in the graph.
- 8. Give approximate value Original: over 600 complaints Suggested revision: about 650 complaints Why it matters: The 1980 domestic-noise point is approximately 650.
- 9. Use concise label Original: concerning domestic disturbances Suggested revision: about domestic noise Why it matters: This wording is shorter and aligns with the graph category.
- 10. Use past tense Original: have Suggested revision: then Why it matters: A completed historical period requires the simple past here.
- 11. Use trend verb Original: was also on a steady increase Suggested revision: also increased steadily Why it matters: The revision expresses the trend directly and naturally.
- 12. Use formal connector Original: till Suggested revision: until Why it matters: Until is more appropriate in a formal report.
Suggested Rewrites
- Department authorities
- type of noises types of noise
- which, in fact, declined which declined
- commotions noise
- authorities have received the most complaints about authorities received complaints about
- 'factories' 'factory noise'
Why this response received Band 6.0
The response gives a clear overview and correctly captures the broad rise in road works, factory and traffic complaints alongside the fall in domestic complaints. Its main weakness is incomplete and occasionally inaccurate detail, especially the claim that complaints peaked at about 2,600 in 1986; the priority is to report accurate endpoints and turning points for each series, including the road-works surge after 1988.
IELTS Writing Criteria Scores
Task Achievement
The overview identifies the main directions correctly, but supporting figures are sparse and the final claim places an approximate combined peak in the wrong year.
Report accurate start and end values and key turning points, especially road works rising from about 400 in 1988 to over 1,200 in 1996.
Coherence and Cohesion
The response moves logically from the overview to individual sources, but the single-block presentation and abrupt final aggregate claim weaken the structure.
Use separate overview and detail paragraphs, grouping the rising series together and contrasting them with declining domestic complaints.
Lexical Resource
The response uses a reasonable range for change, but awkward phrases such as types of commotions and two most noise complaints reduce precision.
Use standard graph vocabulary such as sources of noise, number of complaints, rose steadily, levelled off, and declined.
Grammatical Range and Accuracy
Meaning is generally clear, but tense control, comparative forms, articles, and structures such as reached to highest contain recurring errors.
Use past tense consistently and revise comparison patterns, for example reached its highest point and the two largest increases.
Write this task while it is fresh
Try the same task now. It helps you remember the feedback and write better next time.
IELTS Academic Writing Task 1
The graph below shows the number of complaints made about noise to Environmental Health authorities in the city of Newtown between 1980 and 1996.
Your response
Write the task yourself, then compare your choices with the annotated response.