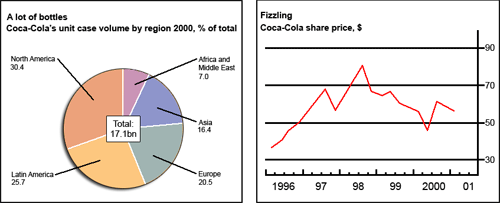
The chart and graph below give information about sales and share prices for Coca-Cola.
Sample Response
The pie chart and the line graph in combination depict Coca-Cola's sales in different markets and its share price over 4 years, commencing from 1996. Overall, North America, Latin America and Europe were Coca-Cola's biggest markets in 2000 and this firm’s share price fluctuated wildly from 1996 to 2001. As can be seen from the chart, North Americans consumed the highest units of Coca-Cola’s products as this region generated 30.4% of total sales. Following this, Latin America was reported to be the second largest market with 25.7% sales. On the other hand, Europeans contributed greatly to Coca-Cola’s profits by consuming 20.5% units. Asia, as well as Africa & Middles East, were not successful markets for Coca-Cola due to its low percentages of sales volume in each region (16.4% and 7% respectively). Regarding the company's share price, it was approximately $38 per share in 1996, the lowest between 1996 and 2001. Next 2 years this brand's trading price at the share market witnessed a significant increase specifically at the end of each year ($70 and $80 respectively) despite a minimal drop to nearly $52 at the beginning of 1998. A remarkable slip back could be seen in the next two years, especially the lowest point of $48 in the middle of 2000. However, this trend changed and climbed back to $60 at the end of 2000 and reached nearly $55 a share in 2001.
IELTS Writing Correction
- 1. Correct time span Original: over 4 years, commencing from 1996 Suggested revision: from 1996 to 2001 Why it matters: The line graph covers the period from 1996 through 2001, not four years.
- 2. Describe sales precisely Original: North Americans consumed the highest units Suggested revision: North America recorded the highest sales volume Why it matters: The chart compares regional sales volume rather than units consumed by residents.
- 3. Add partitive phrase Original: 25.7% sales Suggested revision: 25.7% of total sales Why it matters: A percentage requires 'of' before the measured total.
- 4. Clarify sentence subject Original: Regarding the company's share price, it was Suggested revision: The company's share price was Why it matters: Making 'share price' the subject removes the unclear pronoun reference.
- 5. Use formal trend term Original: A remarkable slip back Suggested revision: A marked decline Why it matters: 'A marked decline' is a more precise expression for a falling price trend.
- 6. Show the result Original: especially the lowest point of $48 Suggested revision: reaching a low of about $48 Why it matters: A participle phrase clearly links the decline to its low point.
- 7. Name the rising subject Original: this trend changed and climbed back Suggested revision: the share price then recovered Why it matters: The share price, rather than the trend itself, is what rises.
- 8. Name the measure precisely Original: sales in different markets Suggested revision: regional sales volume Why it matters: The pie chart compares the volume of sales across regions.
- 9. Use formal comparison Original: biggest markets Suggested revision: largest markets by sales volume Why it matters: This wording states exactly what makes the three regions the largest.
- 10. Use consistent reference Original: this firm’s share price Suggested revision: the company's share price Why it matters: A direct company reference is clearer and more formal than 'this firm'.
- 11. Use neutral trend language Original: wildly Suggested revision: substantially Why it matters: 'Substantially' describes the large movements without subjective emphasis.
- 12. Use direct chart reference Original: As can be seen from the chart, Suggested revision: The pie chart shows that Why it matters: A direct clause links the following comparison clearly to the relevant visual.
Suggested Rewrites
- over 4 years, commencing from 1996 from 1996 to 2001
- North Americans consumed the highest units North America recorded the highest sales volume
- 25.7% sales 25.7% of total sales
- Regarding the company's share price, it was The company's share price was
- A remarkable slip back A marked decline
- especially the lowest point of $48 reaching a low of about $48
Why this response received Band 7.0
The response provides a clear overview and accurately reports most regional shares and major share-price movements, using a logical chart-by-chart sequence. Its main limitation is imprecise interpretation, including describing sales as profits, judging smaller regions as unsuccessful, and omitting the total sales volume, while some awkward language reduces precision. Prioritise strictly factual comparisons from the visuals and use simpler, more natural phrasing for changes in share price.
IELTS Writing Criteria Scores
Task Achievement
The overview and most key percentages and price movements are accurate, though the total sales volume is omitted and a few interpretations go beyond the visuals.
Include the 17.1-billion-unit total and report regional shares neutrally without converting sales into profits or judging markets as successful.
Coherence and Cohesion
The chart-by-chart ordering and cohesive links make the report easy to follow, but presenting the entire response as one paragraph limits structural clarity.
Separate the overview, regional sales details, and share-price trend into distinct paragraphs with clear internal grouping.
Lexical Resource
The response demonstrates a broad range of trend and comparison vocabulary, despite several awkward collocations and the error 'Middles East'.
Choose natural expressions such as 'the share price rose', 'fell sharply', and 'accounted for sales', and proofread geographical names.
Grammatical Range and Accuracy
A variety of complex sentences is generally well controlled, although occasional missing articles, prepositions, and awkward constructions reduce fluency.
Edit compressed phrases such as 'Next 2 years' into complete grammatical forms and check reference and agreement in multi-region comparisons.
Write this task while it is fresh
Try the same task now. It helps you remember the feedback and write better next time.
IELTS Academic Writing Task 1
The chart and graph below give information about sales and share prices for Coca-Cola.
Your response
Write the task yourself, then compare your choices with the annotated response.