The charts below show the changes in ownership of electrical appliances and the amount of time spent doing housework in households in one country between 1920 and 2019.
Sample Response
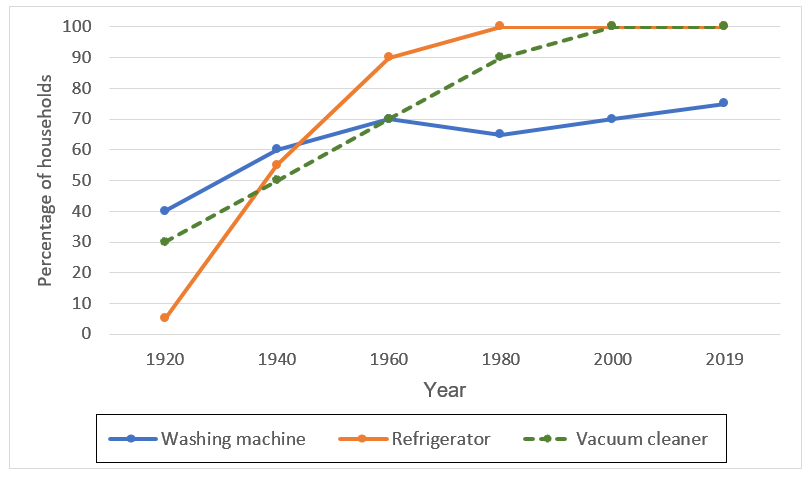
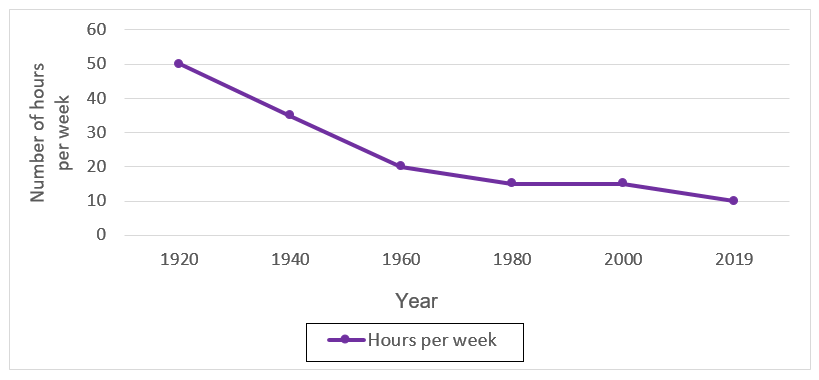
The line graphs show the correlation between the ownership of common household electrical devices and the duration of housework done by families in a country between 1920 and 2019.
Overall, the possession of electrical items by families in this country significantly increased during the period, and as a result, the duration of their weekly housework requirement declined proportionately.
According to the first graph, refrigerators were a rare commodity in houses in 1920, but their presence soared afterwards. Since 1980, every family in this country owned this device at home. A similar, but much smoother trend can be observed with vacuum cleaners, which were present at only three in ten houses a century ago but are now held by 100% of all homes. Lastly, washing machines were owned by 40% of families in 1920 and reached 70% in just four decades. These days, it has remained just below 80%.
The second line chart indicates a direct correlation between the acquisition of essential household appliances and the duration of work required to be done at home. Household work duration dropped dramatically from a high 50 hours per week in 1920 to a mere 10 hours per week in 2019.
IELTS Writing Correction
- 1. Describe chart purpose Original: show the correlation between Suggested revision: show the changes in Why it matters: The introduction should neutrally state what the two graphs display rather than frame them as a correlation.
- 2. Avoid unsupported causality Original: and as a result, Suggested revision: while Why it matters: The graphs show simultaneous trends but do not establish that appliance ownership caused the reduction in housework.
- 3. Correct trend description Original: proportionately Suggested revision: substantially Why it matters: The housework figures do not fall in a constant proportion to appliance ownership.
- 4. Fix presence phrase Original: at only three in ten houses Suggested revision: in only three in ten households Why it matters: An appliance is present in a household, and household matches the unit shown on the chart.
- 5. State timing precisely Original: now held by 100% of all homes Suggested revision: present in all households by 2000 Why it matters: The chart shows vacuum-cleaner ownership reaching 100% in 2000 and remaining there in 2019.
- 6. Correct relationship term Original: direct correlation Suggested revision: inverse relationship Why it matters: Appliance ownership rises while weekly housework hours fall, so the relationship described is inverse.
- 7. Use concise wording Original: duration of work required to be done at home Suggested revision: weekly time spent on housework Why it matters: This concise phrase accurately names the measure in the second graph.
- 8. Use chart terminology Original: graphs Suggested revision: charts Why it matters: Line charts is the standard term for these time-series visuals.
- 9. Specify chart scope Original: common household electrical devices Suggested revision: three household electrical appliances Why it matters: The chart covers three named appliances rather than household devices generally.
- 10. Match the measure Original: duration of housework done by families Suggested revision: weekly time spent on housework per household Why it matters: This wording matches both the unit and household basis shown on the second chart.
- 11. Use concise terminology Original: possession of electrical items by families Suggested revision: household ownership of electrical appliances Why it matters: Ownership is more concise and accurately reflects the percentage measure.
- 12. Avoid awkward wording Original: requirement Suggested revision: time Why it matters: Housework time is a natural expression for the duration measured in hours.
Suggested Rewrites
- show the correlation between show the changes in
- and as a result, while
- proportionately substantially
- at only three in ten houses in only three in ten households
- now held by 100% of all homes present in all households by 2000
- direct correlation inverse relationship
Why this response received Band 7.5
The response is clearly organised and uses a strong range of language to describe the two related trends, with accurate endpoint figures and a clear overview. Its main limitation is selective detail: the dip in washing-machine ownership and the intermediate housework figures are omitted, while the claim of proportional causation overstates what the charts show. Prioritise fuller, strictly descriptive comparisons across the key years.
IELTS Writing Criteria Scores
Task Achievement
The main trends and endpoint data are accurately identified, but important intermediate features are omitted and a proportional causal relationship is asserted without support.
Include the washing-machine dip and housework plateau, and describe the association between the charts without claiming causation or proportionality.
Coherence and Cohesion
Clear paragraphing, logical sequencing and effective referencing make the report easy to follow, with only slight repetition of the correlation framing.
Vary the transition into the second chart and connect the datasets once in the overview rather than repeating the same relationship.
Lexical Resource
A broad range of vocabulary conveys trends effectively, though several choices such as 'held by 100% of all homes' and 'housework requirement' are unnatural.
Use more conventional data-reporting collocations, including 'owned by all households' and 'time spent on housework'.
Grammatical Range and Accuracy
Complex sentences are varied and mostly well controlled, with only occasional agreement, reference and article problems.
Check pronoun agreement and quantity phrasing, particularly the shift from plural 'washing machines' to singular 'it' and 'a high of 50 hours'.
Write this task while it is fresh
Try the same task now. It helps you remember the feedback and write better next time.
IELTS Academic Writing Task 1
The charts below show the changes in ownership of electrical appliances and the amount of time spent doing housework in households in one country between 1920 and 2019.
Your response
Write the task yourself, then compare your choices with the annotated response.