The table below shows the consumer durables (telephone, refrigerator, etc.) owned in Britain from 1972 to 1983.
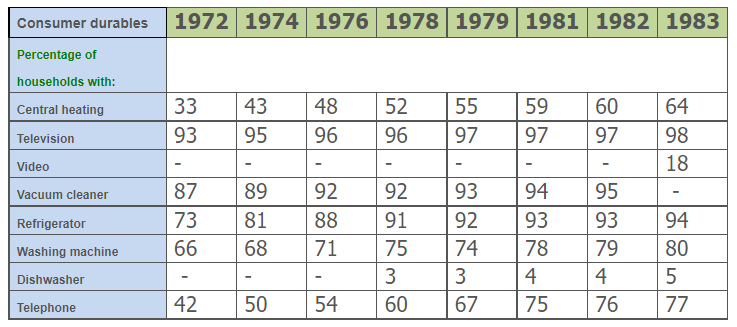
The table below shows the consumer durables (telephone, refrigerator, etc.) owned in Britain from 1972 to 1983.
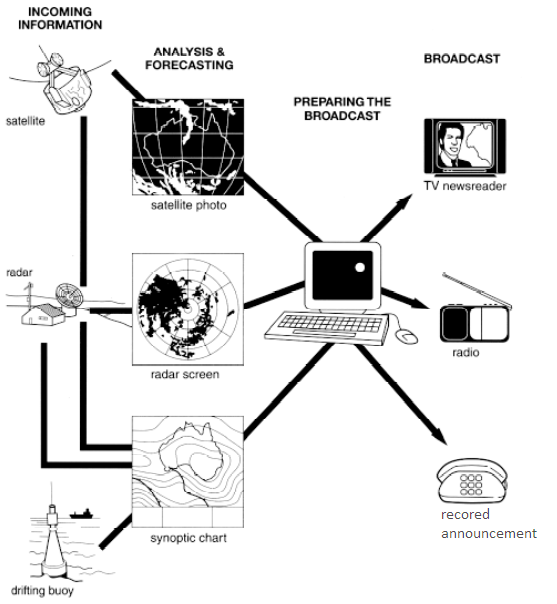
The diagram below shows how the Australian Bureau of Meteorology collects up-to-the-minute information on the weather in order to produce reliable forecasts.
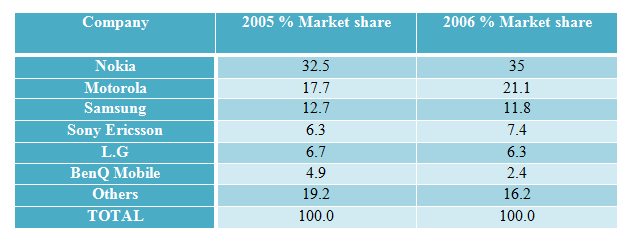
The table shows the worldwide market share of mobile phone manufacturers in the years 2005 and 2006. Worldwide Mobile Phone Sales in 2005 & 2006 (%share of market)
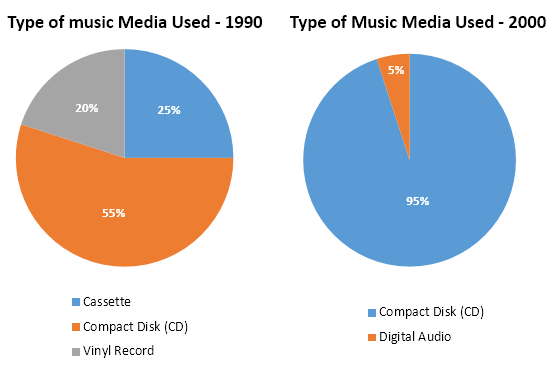
The pie charts below show the types of music media used from 1990 to 2010.
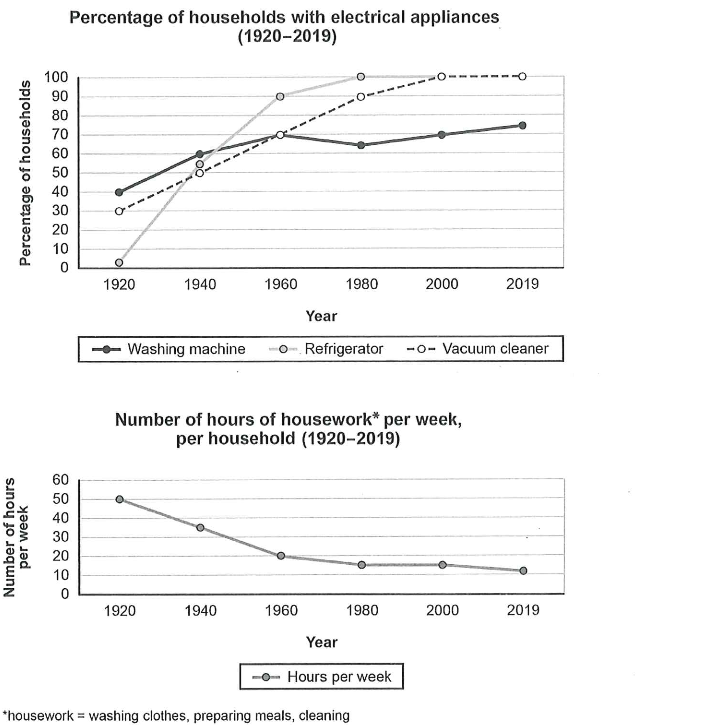
The charts below show the changes in ownership of electrical appliances and amount of time spent doing housework in households in one country between 1920 and 2019. Summarise the information by selecting and reporting the main features, and make comparisons where relevant.