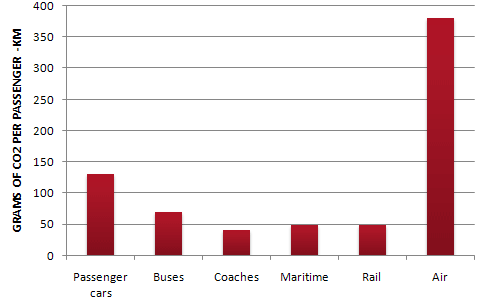
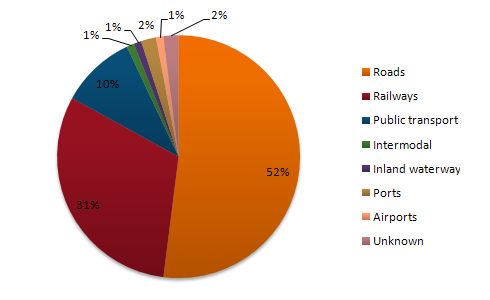
The graph below shows CO 2 emissions for different forms of transport in the European Union. The Pie Chart shows the percentage of European Union funds being spent on different forms of transport.
Sample Response
The column graph shows the amount of CO2 release from different means of transports in the European Union and the pie chart outlines how the European Union distributes its budget on different transportation types. In general, air transports emit the highest volume of C02, and vehicles on roads and railways together consume most of the European Union's expenditure budget on transports. To begin with, nearly 400 grams of CO2 ejection happens when a passenger travels a kilometre in an aeroplane. Following that, personal cars stand at the second position with a remarkably lower figure of CO2 emision - approximately 130 grams per passenger kilometre. Buses are responsible for 70 grams of emission while this figure is 40 grams for coaches, which is the lowest. Finally, the Maritimes and rails are reported to have the same volume of CO2 discharge, 50 grams for a kilometre travel by a passenger. As can be seen from the pie chart, more than half of the transport related expenditure by the EU goes to road transports. Nearly one-third of their total budget is spent on railways and a tenth is used for bus communications. The remaining 7% budget is then spent on other transportation types. [Writtne by - Thuy Linh]
IELTS Writing Correction
- 1. Use uncountable transport Original: transports Suggested revision: transport Why it matters: “Transport” is uncountable in this expression.
- 2. Name the mode naturally Original: transports Suggested revision: travel Why it matters: “Air travel” is the natural term for the transport mode shown in the chart.
- 3. Correct the formula Original: C02 Suggested revision: CO2 Why it matters: The chemical formula uses the letter O, not the number zero.
- 4. Describe spending accurately Original: vehicles on roads and railways together consume Suggested revision: roads and railways together receive Why it matters: The pie chart allocates EU funds to transport categories rather than showing vehicles consuming a budget.
- 5. Use emissions wording Original: CO2 ejection happens Suggested revision: CO2 is emitted Why it matters: “Is emitted” is the standard verb phrase for carbon-dioxide output.
- 6. Use concise ranking Original: stand at the second position Suggested revision: rank second Why it matters: “Rank second” expresses the comparison more directly and naturally.
- 7. Correct the spelling Original: emision Suggested revision: emissions Why it matters: “Emission” is misspelled and should be plural when describing the measured output.
- 8. Use chart labels Original: the Maritimes and rails Suggested revision: maritime transport and rail Why it matters: These terms accurately reproduce the two transport categories in the graph.
- 9. Match the chart category Original: bus communications Suggested revision: public transport Why it matters: The 10% slice is labelled “Public transport,” not buses.
- 10. Remove the byline Original: [Writtne by - Thuy Linh] Suggested revision: Delete Why it matters: A byline is not part of an Academic Task 1 report and interrupts the formal ending.
- 11. Use emissions wording Original: release Suggested revision: emitted Why it matters: This is the natural phrase for the quantity shown by the column chart.
- 12. Use concise budget wording Original: expenditure budget on transports Suggested revision: transport budget Why it matters: The shorter phrase avoids redundancy and the incorrect plural “transports.”
Suggested Rewrites
- transports transport
- transports travel
- C02 CO2
- vehicles on roads and railways together consume roads and railways together receive
- CO2 ejection happens CO2 is emitted
- stand at the second position rank second
Why this response received Band 6.5
The response gives a clear overview and accurately reports almost every important figure across both visuals, with sensible grouping of the smaller spending categories. The main limitation is persistent imprecise wording, including nonstandard transport plurals, "CO2 ejection," and "bus communications," compounded by a single-block structure; prioritise accurate chart terminology and separate the emissions and spending details into distinct paragraphs.
IELTS Writing Criteria Scores
Task Achievement
The overview identifies the dominant features and the detailed figures are accurate, with only the public-transport category mislabeled as bus communications.
Retain the strong data selection while naming every category exactly as shown, especially public transport.
Coherence and Cohesion
The report moves logically from emissions to spending and uses clear sequencing, but the entire response is presented as one undivided block.
Create separate paragraphs for the overview, emissions data, and spending data so the two visuals are easier to follow.
Lexical Resource
There is enough range to describe comparisons and proportions, but frequent awkward or inaccurate terms reduce lexical precision.
Replace expressions such as "CO2 ejection," "road transports," and "bus communications" with standard chart vocabulary.
Grammatical Range and Accuracy
A range of sentence structures communicates the comparisons, though plural forms, articles, possessive reference, and noun phrases are often inaccurate.
Proofread uncountable nouns such as "transport" and revise phrases such as "the remaining 7% of the budget" for grammatical completeness.
Write this task while it is fresh
Try the same task now. It helps you remember the feedback and write better next time.
IELTS Academic Writing Task 1
The graph below shows CO 2 emissions for different forms of transport in the European Union. The Pie Chart shows the percentage of European Union funds being spent on different forms of transport.
Your response
Write the task yourself, then compare your choices with the annotated response.