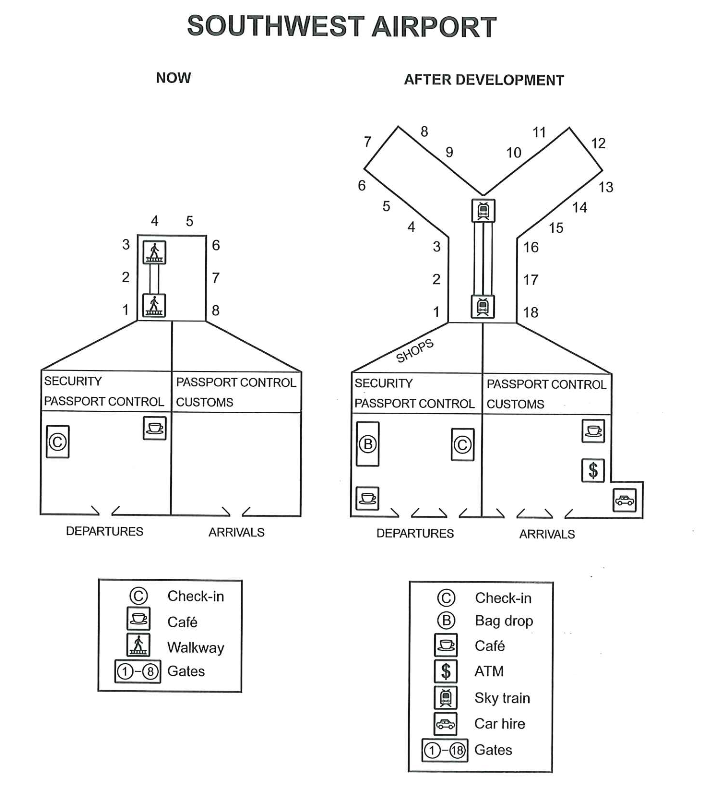
The plans below show the site of an airport now and how it will look after redevelopment next year.
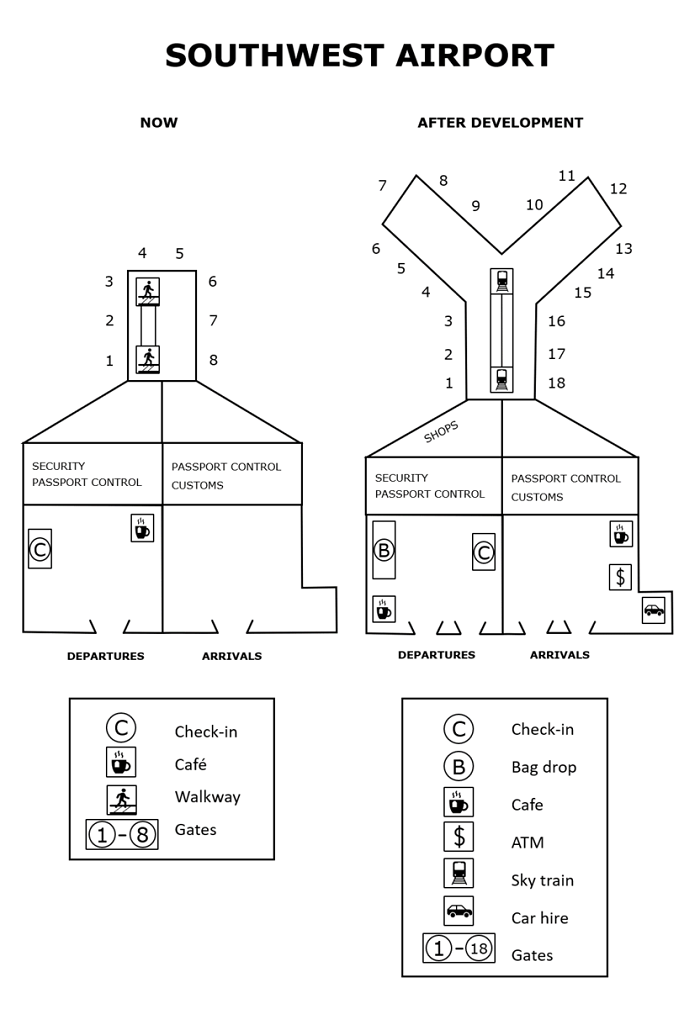
The plans below show the site of an airport now and how it will look after redevelopment next year.
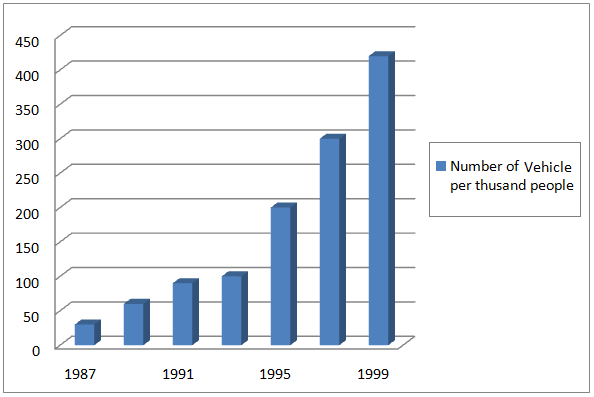
The bar chart below gives information about vehicle ownership in China.
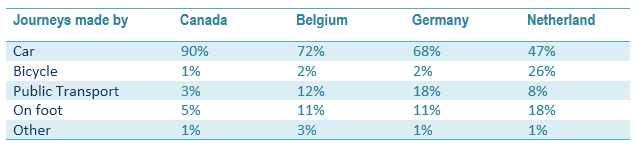
The table below shows the percentage of journey by different means in 4 countries and the bar graph shows the reasons for Canadian people to use a car to reach their workplace.
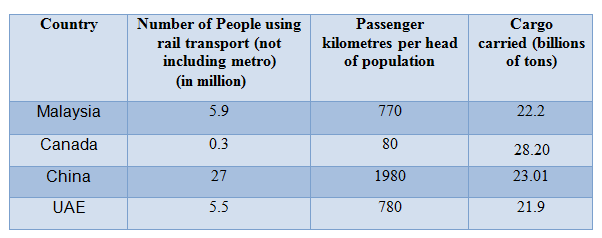
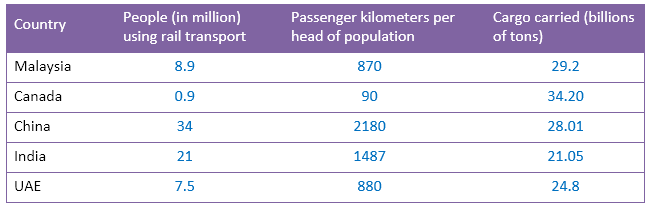
The table below gives information about rail transport in four countries in 2007.
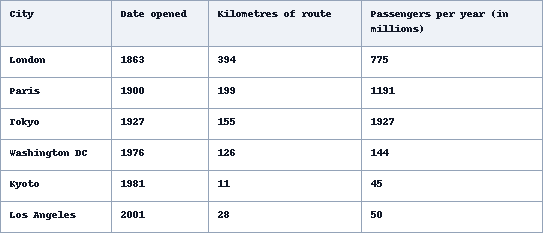
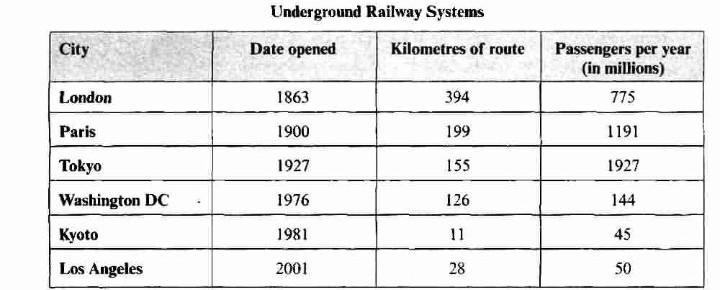
The table below gives information about the underground railway systems in six cities. Underground Railways Systems City Date opened Kilometres of route Passengers per year (in millions) London Paris Tokyo Washington DC Kyoto Los Angeles
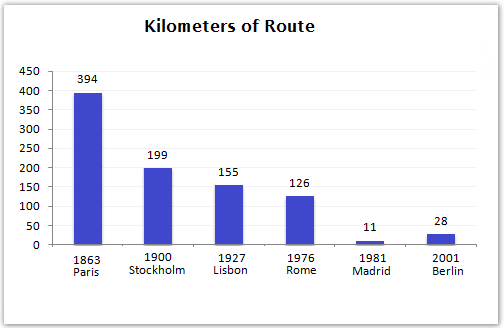
The bar charts below give information about the railway system in six cities in Europe.
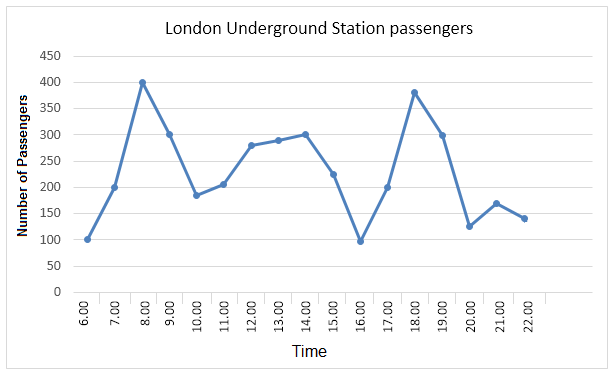
The graph shows Underground Station passenger numbers in London.
The table below gives information about the rail transport in five countries in 2015.
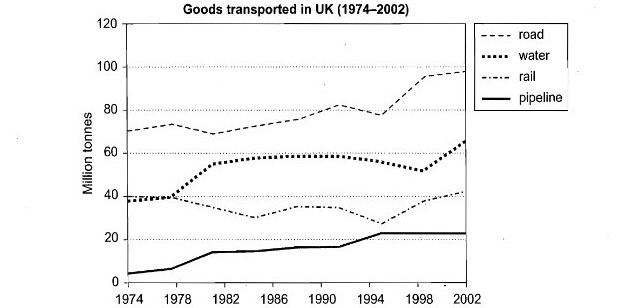
The graph below shows the quantities of goods transported in the UK between 1974 and 2002 by four different modes of transport. Summarise the information by selecting and reporting the main features, and make comparisons where relevant.
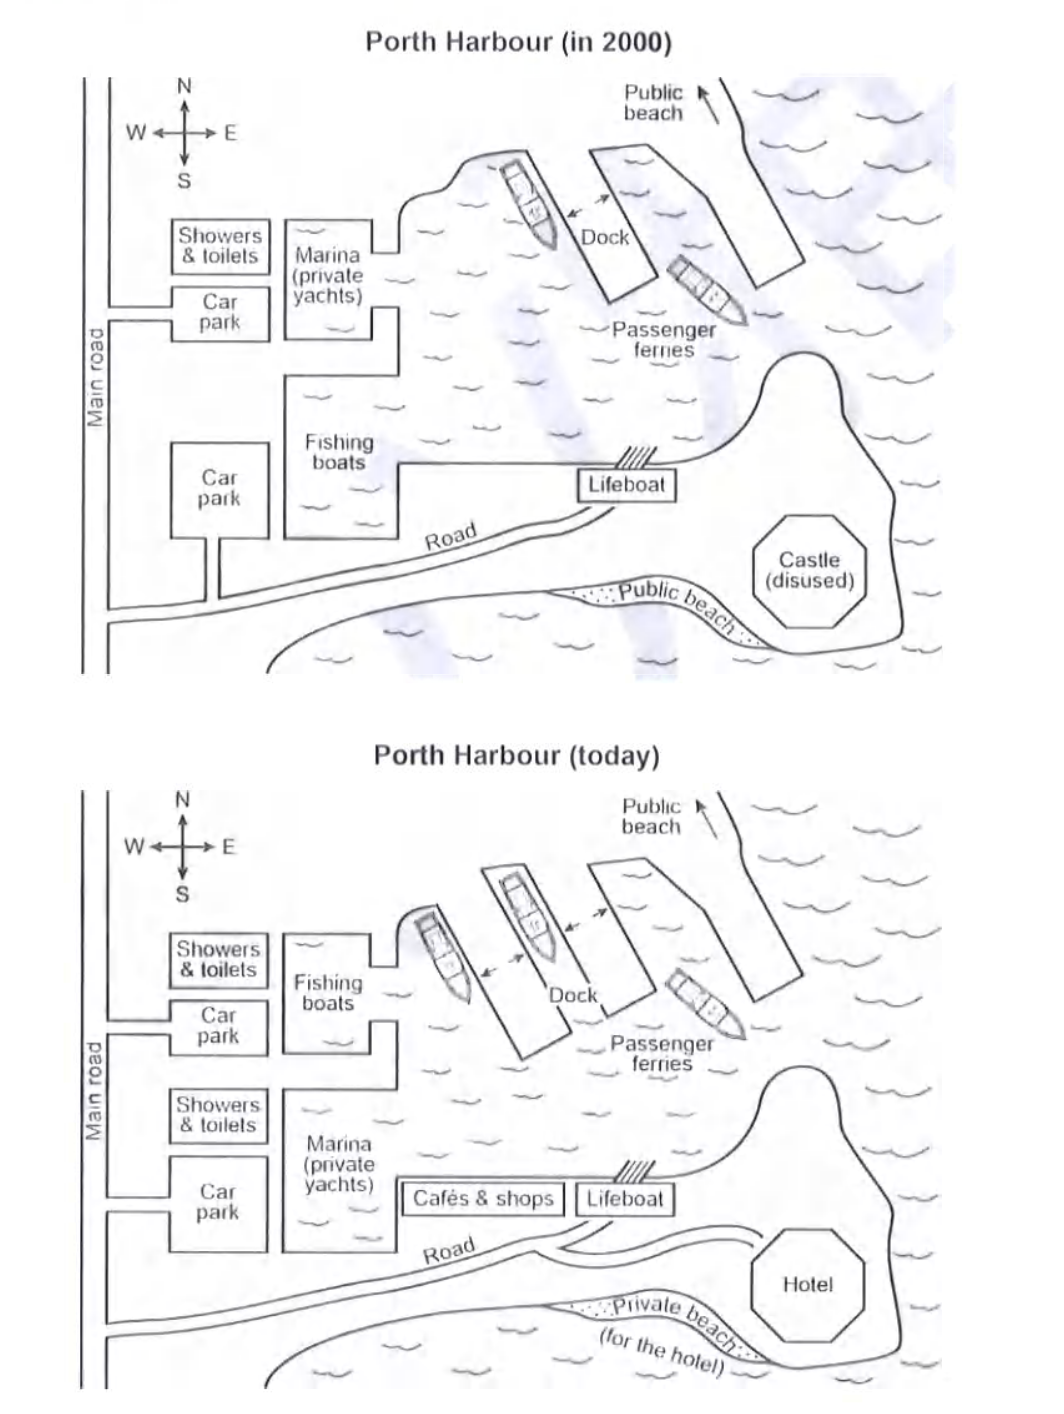
The plans below show a harbour in 2000 and how it looks today. Summarise the information by selecting and reporting the main features, and make comparisons where relevant.
The plans below show the site of an airport now and how it will look after redevelopment next year. Summarize the information by selecting and reporting the main features, and make comparisons where relevant.
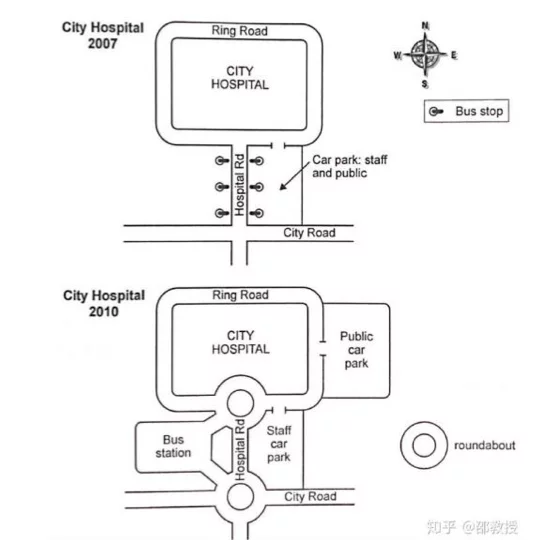
The two maps below show road access to a city hospital in 2007 and in 2010. Summarise the information by selecting and reporting the main features, and make comparisons where relevant.
The table below gives information about the underground railway systems in six cities. Summarise the information by selecting and reporting the main features, and make comparisons where relevant.
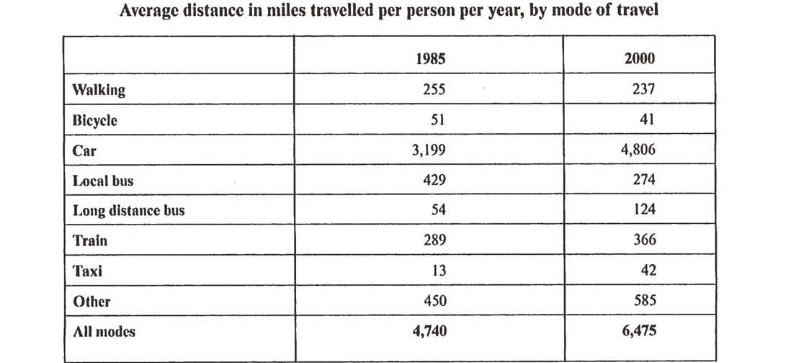
The table below gives information about changes in modes of travel in England between 1985 and 2000. Summarise the information by selecting and reporting the main features, and make comparisons where relevant.