The graphs below provide information on global population figures and figures for urban populations in different world regions.
Sample Response
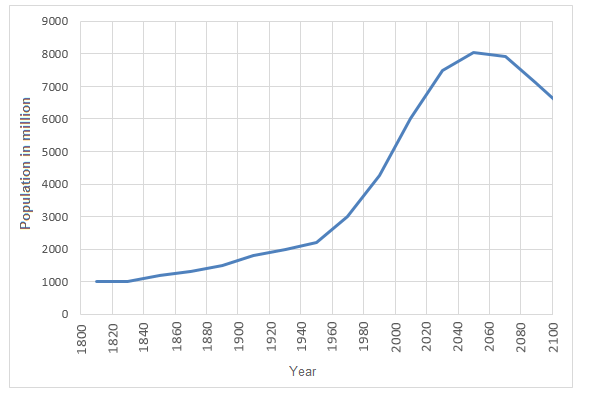
The given illustrations show information on the world population from 1800 to 2100 (with projection) and show the distribution of this population in developed and developing regions. According to the first graph, from 1800 to 1920, the global population was less than 2000 million with a slight increase. But after 1940, this population boomed and reached to 6000 million in the year 2000. The graph shows the projection that this rapid growth o population would continue till 2050 when the population would reach to over 8000 million. But after that, the global population will decrease and will fall to around 6000 million in the year 2100 according to the projection.
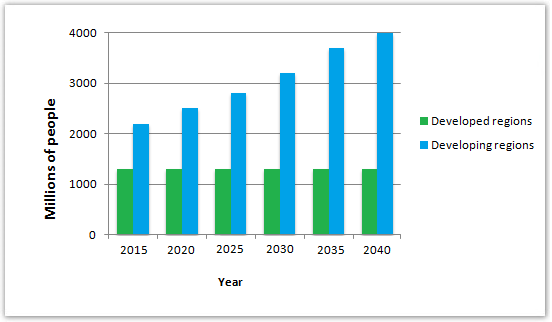
According to the second graph, around 1200 million people lived in the developed regions in 2015 and the population in this part would remain almost the same till 2040. On the contrary, the population of the developing country will keep increasing and would reach to 4000 million in 2040 compared to the initial population of 2100 million in 2015. In summary, the global population will keep on increasing till 2050 and this increase would be more on developing regions than the developed regions. After 2050, it is projected that the total population of the world will be decreasing.
IELTS Writing Correction
- 1. Correct trend magnitude Original: with a slight increase Suggested revision: while rising gradually from about 1,000 to nearly 2,000 million Why it matters: The line nearly doubles between 1800 and 1920, so describing the change as slight understates the visual.
- 2. Correct final figure Original: around 6000 million Suggested revision: around 6,600 million Why it matters: The line ends at approximately 6,600 million in 2100 rather than 6,000 million.
- 3. Remove repeated meaning Original: will decrease and will fall Suggested revision: will decline Why it matters: ‘Decrease’ and ‘fall’ repeat the same meaning, so one precise verb is sufficient.
- 4. Correct developed figure Original: around 1200 million people Suggested revision: around 1,300 million people Why it matters: The developed-regions bar for 2015 is approximately 1,300 million.
- 5. Use precise reference Original: the population in this part Suggested revision: the population in these regions Why it matters: The plural reference accurately and naturally points back to the developed regions.
- 6. Use consistent future Original: would Suggested revision: will Why it matters: The chart presents a future projection, so ‘will’ is consistent with the surrounding time frame.
- 7. Use formal time link Original: till Suggested revision: until Why it matters: ‘Until’ is the more formal choice for describing the end point of this projected period.
- 8. Use contrast linker Original: On the contrary Suggested revision: By contrast Why it matters: The sentence contrasts two regional trends rather than contradicting the preceding statement.
- 9. Match chart category Original: country Suggested revision: regions Why it matters: The visual reports a collective category of developing regions, not one developing country.
- 10. Fix reach construction Original: would reach to 4000 million Suggested revision: will reach 4,000 million Why it matters: ‘Reach’ takes a direct object without ‘to’, and ‘will’ suits the projected figure.
- 11. Correct baseline figure Original: 2100 million in 2015 Suggested revision: 2,200 million in 2015 Why it matters: The developing-regions bar begins at about 2,200 million in 2015.
- 12. Use concise trend phrase Original: keep on increasing till 2050 Suggested revision: continue increasing until 2050 Why it matters: The replacement expresses the projected trend more concisely and formally.
Suggested Rewrites
- with a slight increase while rising gradually from about 1,000 to nearly 2,000 million
- around 6000 million around 6,600 million
- will decrease and will fall will decline
- around 1200 million people around 1,300 million people
- the population in this part the population in these regions
- would will
Why this response received Band 7.0
The response clearly identifies the principal population trends, including the mid-century global peak, subsequent decline, and widening contrast between developing and developed regions. Its main limitation is uneven precision: several figures are slightly inaccurate, some comparisons are only briefly developed, and recurring forms such as “reached to” weaken control; prioritise exact data reporting and more natural language for projections and comparisons.
IELTS Writing Criteria Scores
Task Achievement
The response provides a clear overview and selects the main trends and contrasts from both graphs, despite several slightly inaccurate values and limited supporting detail.
Report the peak and final population more precisely and add one or two accurate intermediate comparisons from each graph.
Coherence and Cohesion
Information progresses logically by graph, with clear paragraphing and generally effective linking, although the overview is attached to the second detail paragraph.
Place the overall trends in a distinct overview and use more direct cross-category comparisons within the detail paragraphs.
Lexical Resource
A sufficient range of trend and comparison vocabulary conveys the data clearly, but imprecise choices such as “boomed,” “this part,” and “developing country” reduce precision.
Use consistent academic terms such as “rose sharply,” “developed regions,” and “developing regions,” while checking collocations used with figures.
Grammatical Range and Accuracy
The response uses a useful mix of simple and complex structures, but recurring preposition, article, agreement, and projection-form errors reduce grammatical control.
Practise accurate data structures such as “reached 6,000 million,” “is projected to rise,” and “growth in developing regions.”
Write this task while it is fresh
Try the same task now. It helps you remember the feedback and write better next time.
IELTS Academic Writing Task 1
The graphs below provide information on global population figures and figures for urban populations in different world regions.
Your response
Write the task yourself, then compare your choices with the annotated response.