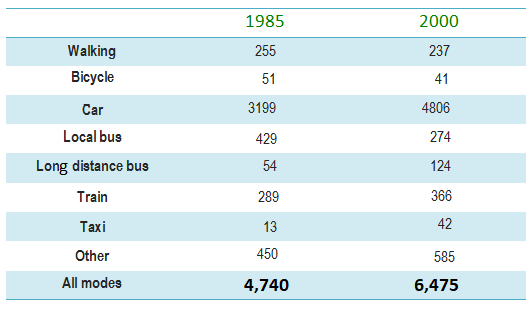
The table below gives information about changes in modes of travel in England between 1985 and 2000. Average distance in miles travelled per person per year, by mode of travel
Sample Response
The table data shows information about the type of transportation used by the British between 1985 and 2000. As is presented in the table, using the car was the most common way of travelling by English both in 1985 and 2000. In 1985, more than 3,000 miles were travelled by an average British using cars. It increased to well over 4,500 in the year 2000. The second most common way of travelling was the local bus which was far less commonly used than that cars. Over time, the use of local buses decreased, becoming just over 250 from an initial 429 miles. The taxi was the least preferred transport both years amounting to only 13 miles and 42 miles per person in these two years. The bicycle was used for an average of 50 miles travel by each person in 1985 and that decreased to 41 miles in 2000 which show the decline of bicycle usages by British. Train and local distance buses were two other modes of transport used by the British, and their popularity increased over time. In 1985, 255 miles were travelled by a British citizen on foot while this distance decreased slightly in 2000. All other transportations used comprised about 450 miles per person in 1985 which increased to 585 in 2000. Finally, a British travelled around 4700 miles in 1985 which rose to over 6400 miles after 15 years.
IELTS Writing Correction
- 1. Remove redundant wording Original: The table data shows information about Suggested revision: The table shows Why it matters: Table, data, and information unnecessarily repeat the same idea.
- 2. Use plural category Original: the type of transportation Suggested revision: modes of transport Why it matters: The table compares several distinct ways of travelling.
- 3. Add a people noun Original: travelling by English Suggested revision: travel among people in England Why it matters: English cannot stand alone here as a noun for individual travellers.
- 4. Name the traveller Original: an average British Suggested revision: an average person in England Why it matters: British is an adjective and needs a following noun in this construction.
- 5. Fix comparison form Original: than that cars Suggested revision: than cars Why it matters: That is unnecessary and ungrammatical before the plural noun.
- 6. State exact change Original: becoming just over 250 from an initial 429 miles Suggested revision: falling from 429 to 274 miles Why it matters: This directly and accurately reports the local-bus figures.
- 7. Correct figure and phrase Original: 50 miles travel Suggested revision: 51 miles of travel Why it matters: The table shows 51 miles in 1985, and the noun phrase requires of.
- 8. Match singular subject Original: show Suggested revision: shows Why it matters: The relative clause refers to the singular decrease.
- 9. Use uncountable noun Original: usages Suggested revision: use Why it matters: Use is uncountable when referring generally to this travel mode.
- 10. Complete noun phrase Original: by British Suggested revision: by people in England Why it matters: British requires a noun or the definite article when referring to people.
- 11. Correct mode name Original: local distance buses Suggested revision: long-distance buses Why it matters: The table category is long-distance bus, not local-distance bus.
- 12. Describe measured quantity Original: their popularity increased Suggested revision: the distances travelled by both increased Why it matters: The table measures annual distance rather than popularity.
Suggested Rewrites
- The table data shows information about The table shows
- the type of transportation modes of transport
- travelling by English travel among people in England
- an average British an average person in England
- than that cars than cars
- becoming just over 250 from an initial 429 miles falling from 429 to 274 miles
Why this response received Band 6.5
The response covers every travel mode, accurately highlights cars as dominant, and supports most changes with appropriate figures. Its overview is too narrow, while recurring awkward noun and comparison forms reduce linguistic precision despite generally clear meaning. Add the overall rise in total distance and contrast the modes that fell with those that grew, then proofread articles, agreement, and comparative structures.
IELTS Writing Criteria Scores
Task Achievement
Cars are correctly identified as dominant and all modes are covered with mostly accurate data, but the overview does not summarise the overall increase or contrasting trends.
State that total distance rose substantially and distinguish walking, bicycle, and local-bus declines from increases in the other modes.
Coherence and Cohesion
The account follows a generally logical sequence and comparisons are easy to trace, but the single-block presentation and item-by-item progression limit grouping.
Create a distinct overview and group the details by modes that increased and modes that decreased.
Lexical Resource
Relevant transport vocabulary is used with some range, though awkward forms such as travelling by English and bicycle usages reduce precision.
Use natural combinations such as English people, car travel, bicycle use, and modes of transport.
Grammatical Range and Accuracy
Both simple and complex structures are attempted, but article, agreement, comparison, and noun-form errors recur throughout.
Proofread forms such as than cars, which shows, and miles travelled by an average person.
Write this task while it is fresh
Try the same task now. It helps you remember the feedback and write better next time.
IELTS Academic Writing Task 1
The table below gives information about changes in modes of travel in England between 1985 and 2000. Average distance in miles travelled per person per year, by mode of travel
Your response
Write the task yourself, then compare your choices with the annotated response.