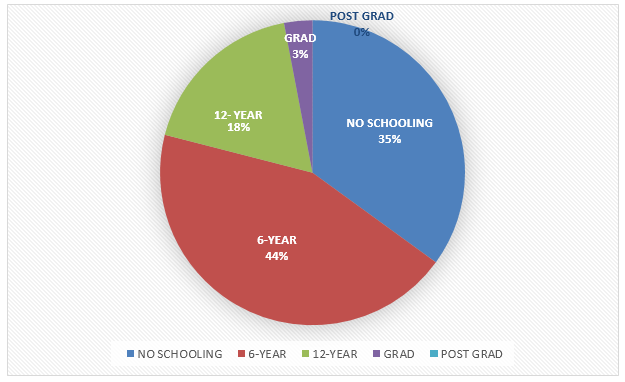
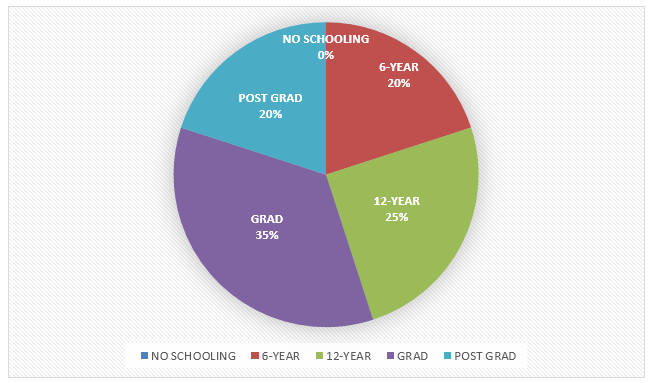
The pie charts show the highest education level of women in Sri Lanka in 1965 and 1995.
Sample Response
The pie charts compare the women education level in Sri Lanka across two different years with a gap of 30 years. Overall, Sri Lankan women's education level in 1995 was significantly better than that of three decades earlier. In 1965, only 15% Sri Lankan women completed secondary education and only 3% completed their graduation. No women, in this year achieved a post-graduation qualification. A great percentage of Sri Lankan women, 35% to be exact, did not go to school at all. In 1995, 80% Sri Lankan women had completed their secondary education which was a remarkable improvement compared to the scenario 30 years earlier. 55% females had achieved graduation degrees while 20% had completed post-graduation studies. In this year, all girls attended schools and completed their primary education, though 20% of them ended their schooling at this point. This is a stark contrast with the women education level in 1965 when more than one-third of them received no education at all and 65% ended with the elementary education only.
IELTS Writing Correction
- 1. Use possessive noun Original: compare the women education level Suggested revision: compare women’s education levels Why it matters: The possessive form and plural noun are required for the two distributions.
- 2. Condense time comparison Original: across two different years with a gap of 30 years Suggested revision: in two years 30 years apart Why it matters: The revision expresses the interval more concisely.
- 3. Use precise term Original: Sri Lankan women's education level Suggested revision: the educational attainment of Sri Lankan women Why it matters: Educational attainment is the precise term for the highest level completed.
- 4. Remove faulty interruption Original: No women, in this year achieved Suggested revision: No women achieved Why it matters: The comma separates the subject from its verb and the time reference is already clear.
- 5. Use correct compound Original: post-graduation qualification Suggested revision: postgraduate qualification Why it matters: Postgraduate is the standard adjective for this qualification level.
- 6. Use data language Original: A great percentage Suggested revision: A large proportion Why it matters: Large proportion is the natural phrase for describing a pie-chart share.
- 7. Add percentage preposition Original: 80% Sri Lankan women Suggested revision: 80% of Sri Lankan women Why it matters: A percentage followed by a noun group requires of.
- 8. Clarify cumulative total Original: had completed their secondary education Suggested revision: had completed secondary education or higher Why it matters: The 80% total includes the 12-year, graduate, and postgraduate categories.
- 9. Refer to prior data Original: scenario Suggested revision: figures Why it matters: Figures refers more precisely to the earlier chart data.
- 10. Add preposition Original: 55% females Suggested revision: 55% of women Why it matters: The percentage construction requires of, and women is more appropriate than females here.
- 11. Clarify combined categories Original: achieved graduation degrees Suggested revision: attained graduate or postgraduate qualifications Why it matters: The combined 55% consists of 35% graduates and 20% postgraduates.
- 12. Use chart category Original: post-graduation studies Suggested revision: postgraduate qualifications Why it matters: The chart reports highest qualifications rather than participation in studies.
Suggested Rewrites
- compare the women education level compare women’s education levels
- across two different years with a gap of 30 years in two years 30 years apart
- Sri Lankan women's education level the educational attainment of Sri Lankan women
- No women, in this year achieved No women achieved
- post-graduation qualification postgraduate qualification
- A great percentage A large proportion
Why this response received Band 6.5
The response presents a clear overall improvement in women’s education and makes useful comparisons between 1965 and 1995. Its main limitation is that some category figures are misreported or merged unclearly, notably 15% for secondary education in 1965 and the claim that 65% ended with elementary education. Report each chart category directly before combining figures, and verify every total against the visual.
IELTS Writing Criteria Scores
Task Achievement
The overview captures the major improvement and most figures are relevant, but some values and combined-category claims do not match the charts precisely.
Report the five categories separately first, including 18% at 12-year education in 1965, before deriving any combined totals.
Coherence and Cohesion
The response moves clearly from an overview to 1965, then 1995, and finishes with a direct contrast between the years.
Separate the overview and year-by-year details into distinct paragraphs to make the comparison structure more visible.
Lexical Resource
The report uses a useful range of comparison language, but awkward expressions such as “women education level” and “completed their graduation” reduce precision.
Use accurate education terms such as “women’s educational attainment,” “graduates,” and “postgraduate qualifications.”
Grammatical Range and Accuracy
Complex comparisons are generally understandable, but missing articles, awkward noun phrases, and punctuation errors occur across the response.
Add required prepositions and determiners in percentage statements, for example “15% of Sri Lankan women,” and remove misplaced commas.
Write this task while it is fresh
Try the same task now. It helps you remember the feedback and write better next time.
IELTS Academic Writing Task 1
The pie charts show the highest education level of women in Sri Lanka in 1965 and 1995.
Your response
Write the task yourself, then compare your choices with the annotated response.