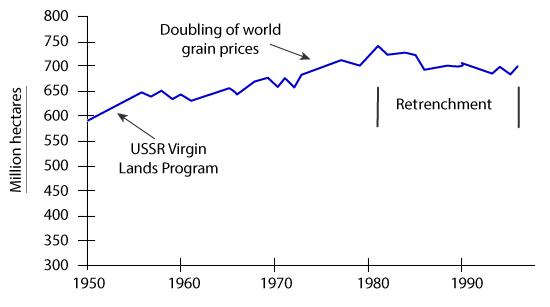
The graph below shows the area of land from which grain was harvested.
Sample Response
The line graph presents data on the worldwide grain harvesting area from 1950 to 1996. As is clear from the given illustration, global grain harvesting areas increased gradually and grain price, land programmes and retrenchment had effects on the land area where grain was harvested. According to the given illustration, just below 600 million hectares land was used globally to grow different crops. The USSR Virgin Lands Program was launched after 1950 and it increased the total land area for agricultural cultivations. The gradual increases with some fluctuations could be observed over the period and in 1970, harvested land area amounted over 650 million hectares. The grain price was doubled around 1974-75 and that contributed towards increasing harvesting areas. The highest land area for harvesting could be observed in 1998 when it was about 750 million hectares. From 1980 till the year 1996 retrenchment decreased the global harvested area and in 1996 it was around 670 million hectares.
IELTS Writing Correction
- 1. Use precise noun phrase Original: worldwide grain harvesting area Suggested revision: worldwide area harvested for grain Why it matters: This phrasing describes the measured land area more precisely.
- 2. Use singular area Original: global grain harvesting areas Suggested revision: the global area harvested for grain Why it matters: The graph tracks one aggregate global land area, so the plural form is inaccurate.
- 3. Use plural noun Original: price Suggested revision: prices Why it matters: The chart annotation refers to world grain prices in the plural.
- 4. Use concise verb Original: had effects on Suggested revision: affected Why it matters: The verb expresses the relationship more directly and naturally.
- 5. Add required preposition Original: just below 600 million hectares land Suggested revision: just below 600 million hectares of land Why it matters: A quantity measured in hectares requires 'of' before 'land'.
- 6. Match the visual Original: different crops Suggested revision: grain Why it matters: The graph concerns land harvested for grain, not land used for unspecified crops.
- 7. Give clearer timing Original: launched after 1950 Suggested revision: launched in the early 1950s Why it matters: The chart places the Virgin Lands Programme near the beginning of the period.
- 8. Use uncountable noun Original: cultivations Suggested revision: cultivation Why it matters: 'Cultivation' is normally uncountable when referring generally to farming activity.
- 9. Use singular trend Original: increases Suggested revision: increase Why it matters: The response describes one overall rising trend, so a singular noun is needed.
- 10. Correct amount phrase Original: harvested land area amounted over Suggested revision: the harvested area amounted to over Why it matters: 'Amounted' requires 'to' before the numerical value.
- 11. Use active construction Original: grain price was doubled Suggested revision: grain prices doubled Why it matters: The chart shows prices increasing twofold rather than being doubled by a stated agent.
- 12. Clarify measured area Original: increasing harvesting areas Suggested revision: increasing the harvested area Why it matters: The graph measures the total area harvested, making this singular phrasing more accurate.
Suggested Rewrites
- worldwide grain harvesting area worldwide area harvested for grain
- global grain harvesting areas the global area harvested for grain
- price prices
- had effects on affected
- just below 600 million hectares land just below 600 million hectares of land
- different crops grain
Why this response received Band 6.5
The response identifies the broad long-term rise and mentions the chart's contextual events, while its chronological progression is generally easy to follow. However, it misdates the peak as 1998, places it beyond the chart's timeframe, and understates the 1996 endpoint; the highest-priority improvement is to verify every year and value against the graph and give a clearer overview of the rise, peak, and later fluctuation.
IELTS Writing Criteria Scores
Task Achievement
The main trend and relevant contextual events are identified, but the peak year and final value are materially inaccurate.
State that the area peaked at roughly 740 million hectares around 1981 and ended near 700 million in 1996.
Coherence and Cohesion
The information follows the timeline coherently, although presenting the entire report as one paragraph weakens its organisation.
Separate the overview from the detailed chronological description and group the pre-peak and post-peak periods.
Lexical Resource
The response uses a reasonable range of trend vocabulary, but several collocations such as 'harvesting areas' and 'agricultural cultivations' are imprecise.
Use precise combinations such as 'harvested area,' 'agricultural land,' and 'rose to over 650 million hectares.'
Grammatical Range and Accuracy
A mix of simple and complex structures communicates the meaning clearly despite recurring article, preposition, and noun-form errors.
Improve control of structures such as 'hectares of land,' 'amounted to,' and 'from 1980 to 1996.'
Write this task while it is fresh
Try the same task now. It helps you remember the feedback and write better next time.
IELTS Academic Writing Task 1
The graph below shows the area of land from which grain was harvested.
Your response
Write the task yourself, then compare your choices with the annotated response.