IELTS Academic Writing Task 1
Đề IELTS Academic Task 1 biểu đồ đường
Tổng hợp đề Task 1 dạng biểu đồ đường từ Cambridge IELTS và Official Guide để luyện mô tả xu hướng, thay đổi và so sánh.
Dạng đề Biểu đồ đường
Đề 11
Nhóm nguồn 10
Duyệt Academic Task 1 theo dạng đề
Chuyển giữa biểu đồ cột, biểu đồ đường, bảng, biểu đồ tròn, bản đồ, quy trình và biểu đồ kết hợp.
Biểu đồ cột Tổng hợp đề Task 1 dạng biểu đồ cột từ Cambridge IELTS và Official Guide để luyện so sánh số liệu, nhóm hạng mục và xu hướng. Biểu đồ đường Tổng hợp đề Task 1 dạng biểu đồ đường từ Cambridge IELTS và Official Guide để luyện mô tả xu hướng, thay đổi và so sánh. Bảng số liệu Tổng hợp đề Task 1 dạng bảng từ Cambridge IELTS và Official Guide để luyện phần trăm, xếp hạng và so sánh nhiều cột. Biểu đồ tròn Tổng hợp đề Task 1 dạng biểu đồ tròn từ Cambridge IELTS và Official Guide để luyện tỉ lệ, thị phần và phân bố hạng mục. Bản đồ Tổng hợp đề Task 1 dạng bản đồ và sơ đồ mặt bằng từ Cambridge IELTS và Official Guide để luyện mô tả vị trí, bố cục và phát triển. Quy trình Tổng hợp đề Task 1 dạng quy trình từ Cambridge IELTS và Official Guide để luyện sản xuất, chu trình tự nhiên và trình tự bước. Biểu đồ kết hợp Tổng hợp đề Task 1 dạng biểu đồ kết hợp từ Cambridge IELTS và Official Guide, gồm chart-table và nhiều biểu đồ trong một đề.
Luyện đề biểu đồ đường từ nguồn IELTS thật
Các đề biểu đồ đường giúp luyện ngôn ngữ xu hướng, mốc thời gian, điểm cao/thấp và chuyển động tổng quan.
Cambridge IELTS Academic quyển 21
1 đề trong quyển này.
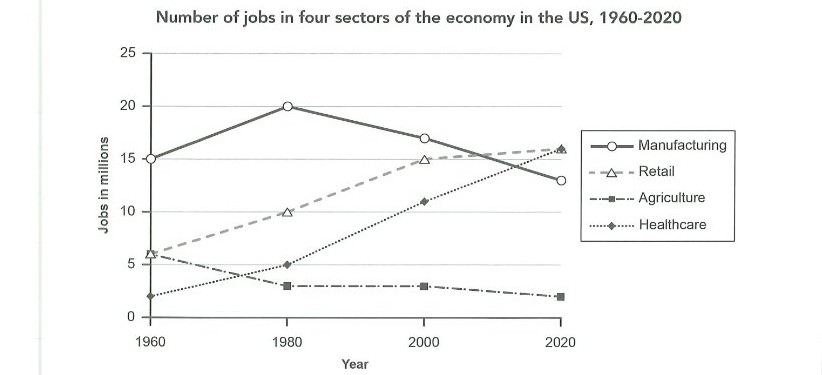
The graph below gives information about the number of jobs in four sectors of the economy in the US between 1960 and 2020.
Summarise the information by selecting and reporting the main features, and make comparisons where relevant.
Hình đề Task 1 trong Cambridge IELTS Academic quyển 21 Writing Test 1.
Cambridge IELTS Academic quyển 19
1 đề trong quyển này.
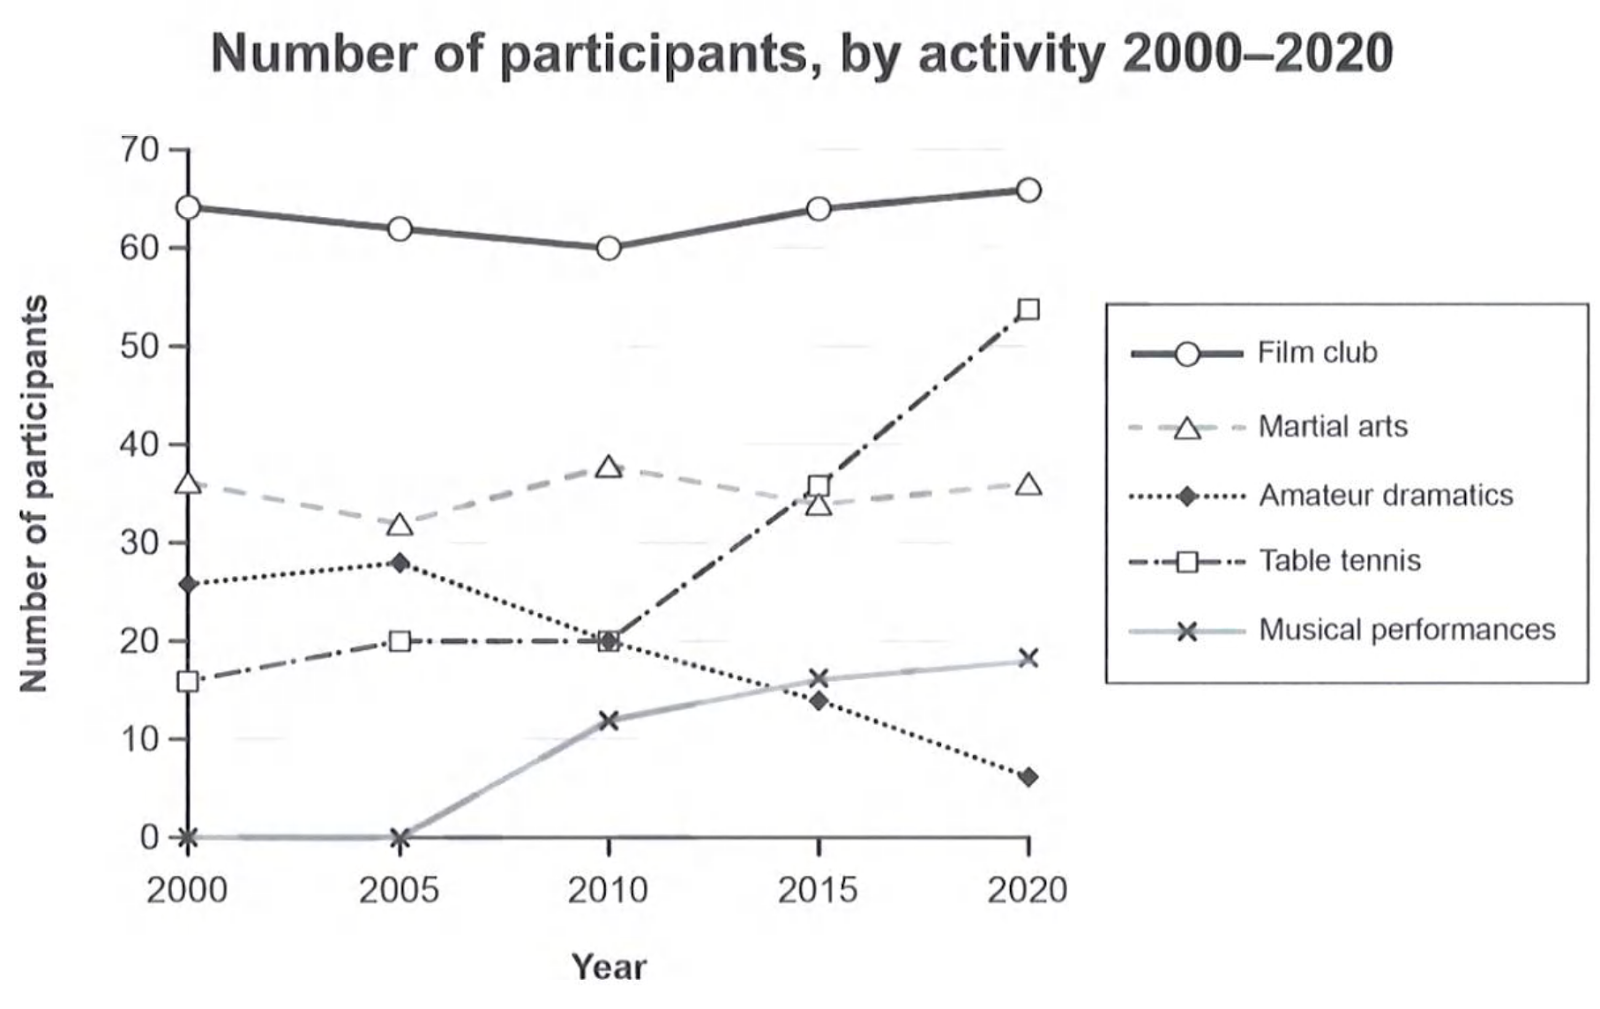
The graph below gives information on the numbers of participants for different activities at one social centre in Melbourne, Australia for the period 2000 to 2020.
Summarise the information by selecting and reporting the main features, and make comparisons where relevant.
Hình đề Task 1 trong Cambridge IELTS Academic quyển 19 Writing Test 1.
Cambridge IELTS Academic quyển 18
2 đề trong quyển này.
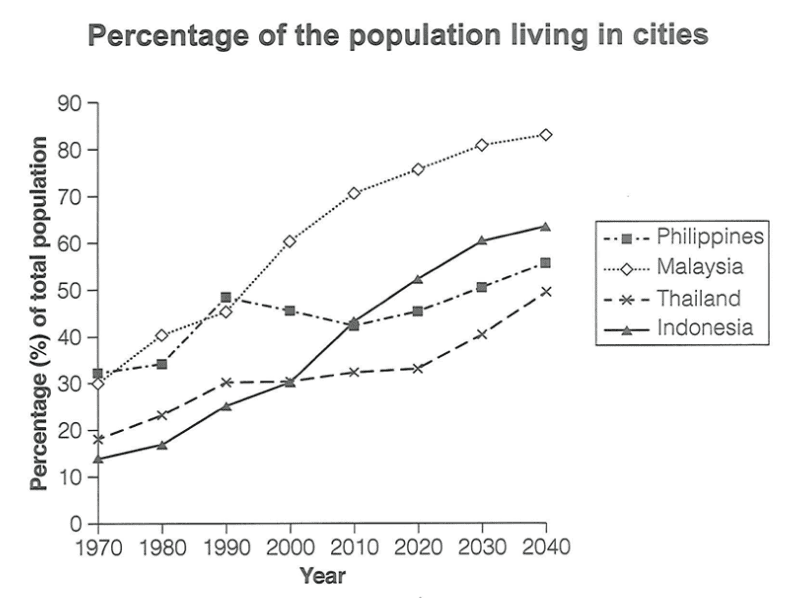
The graph below gives information about the percentage of the population in four Asian countries living in cities from 1970 to 2020, with predictions for 2030 and 2040.
Summarise the information by selecting and reporting the main features, and make comparisons where relevant.
Hình đề Task 1 trong Cambridge IELTS Academic quyển 18 Writing Test 1.
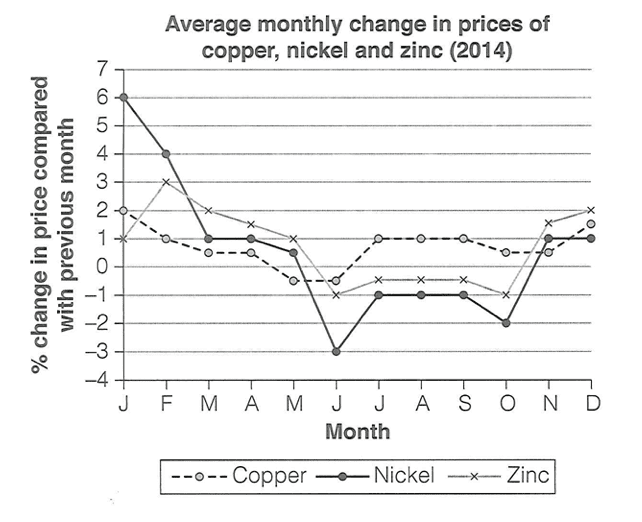
The graph below shows the average monthly change in the prices of three metals during 2014.
Summarise the information by selecting and reporting the main features, and make comparisons where relevant.
Hình đề Task 1 trong Cambridge IELTS Academic quyển 18 Writing Test 4.
Cambridge IELTS Academic quyển 17
1 đề trong quyển này.
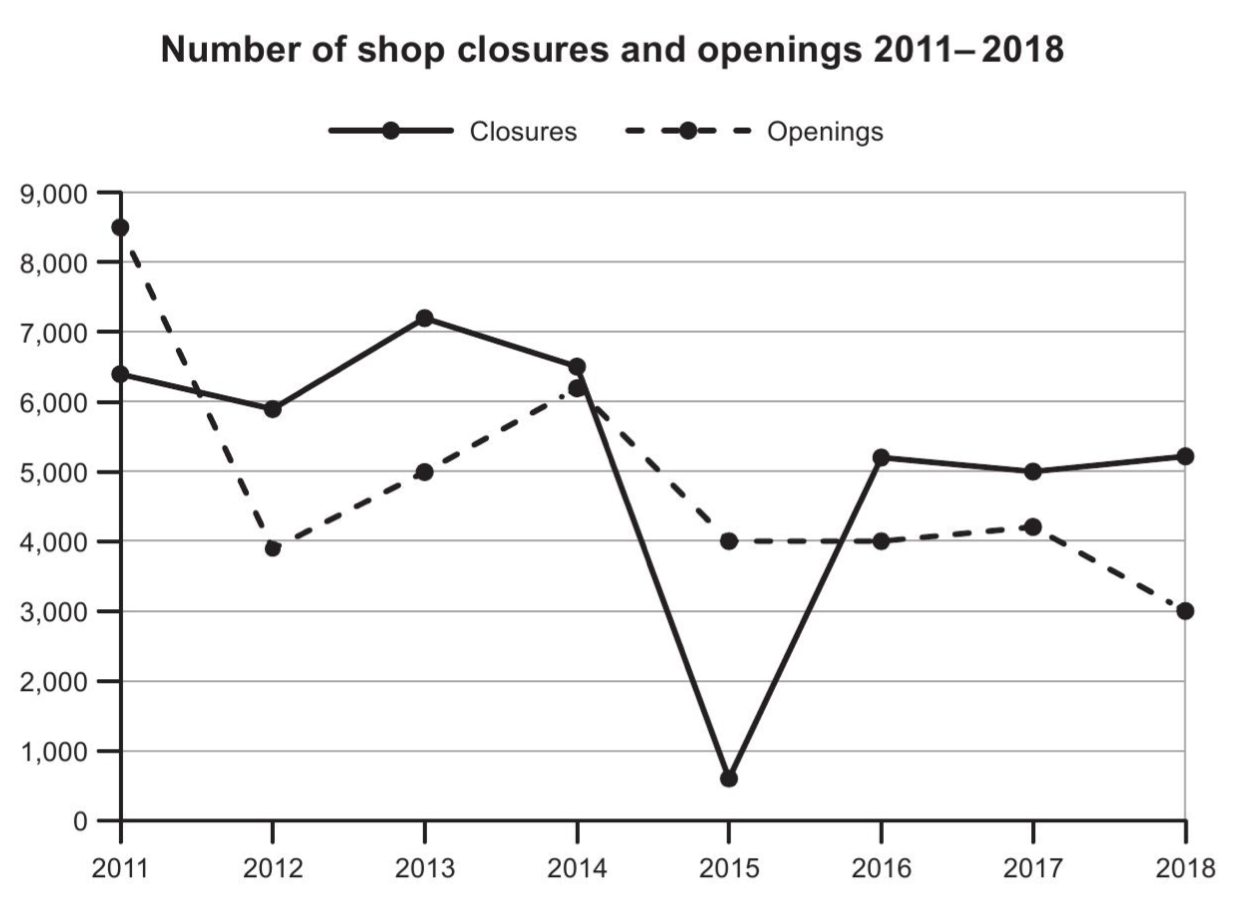
The graph below shows the number of shops that closed and the number of new shops that opened in one country between 2011 and 2018.
Summarise the information by selecting and reporting the main features, and make comparisons where relevant.
Hình đề Task 1 trong Cambridge IELTS Academic quyển 17 Writing Test 4.
Cambridge IELTS Academic quyển 15
1 đề trong quyển này.
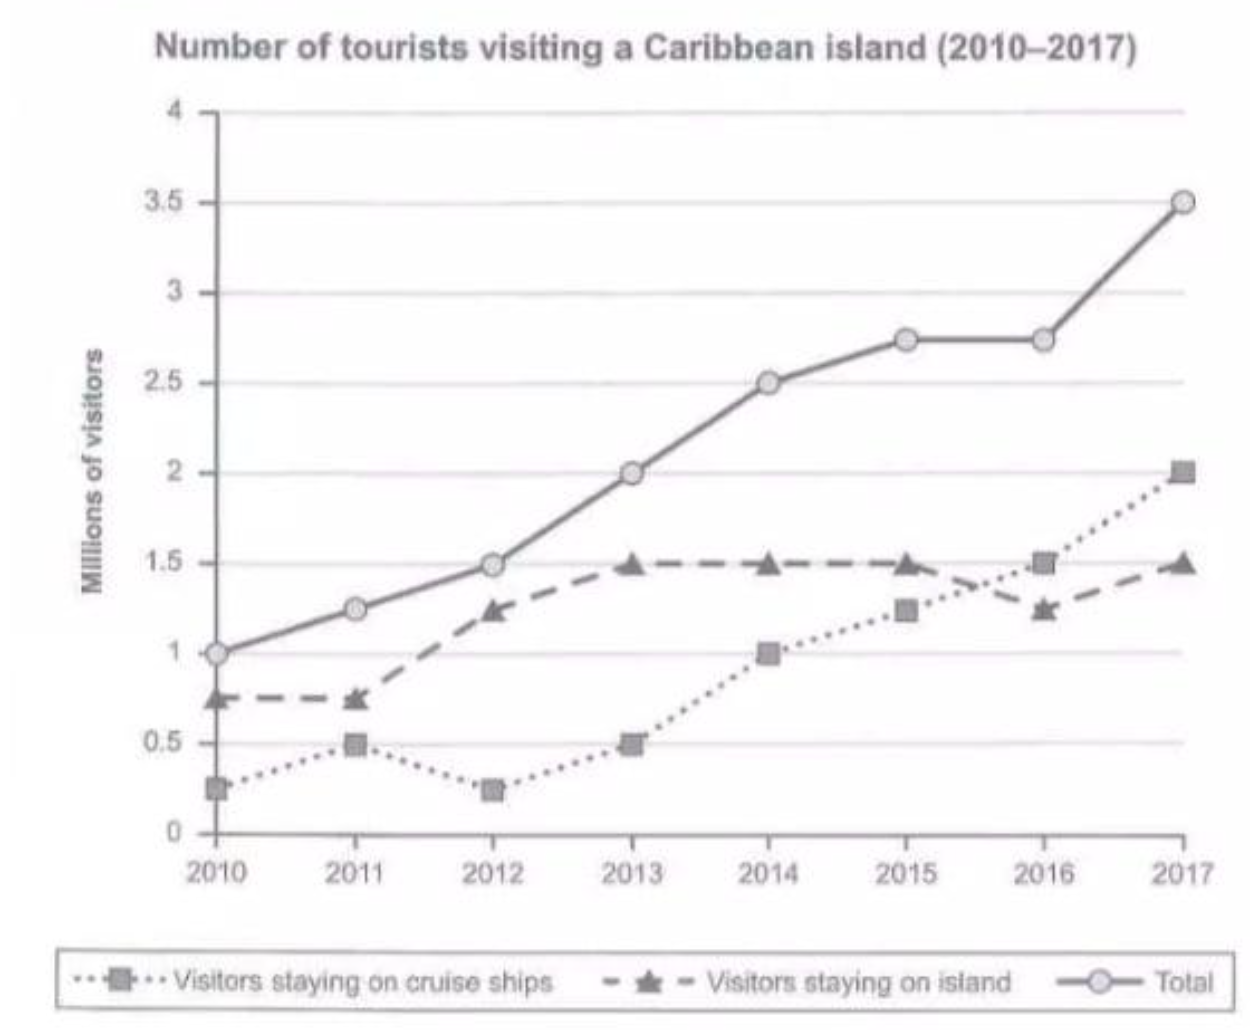
The graph below shows the number of tourists visiting a particular Caribbean island between 2010 and 2017.
Summarize the information by selecting and reporting the main features, and make comparisons where relevant.
Hình đề Task 1 trong Cambridge IELTS Academic quyển 15 Writing Test 2.
Cambridge IELTS Academic quyển 11
1 đề trong quyển này.
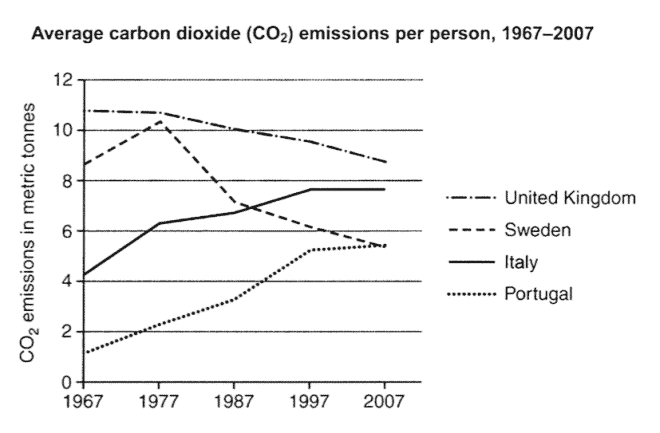
The graph below shows the average carbon dioxide (CO2) emissions per person in the United Kingdom, Sweden, Italy and Portugal between 1967 and 2007.
Summarise the information by selecting and reporting the main features, and make comparisons where relevant.
Hình đề Task 1 trong Cambridge IELTS Academic quyển 11 Writing Test 3.
Cambridge IELTS Academic quyển 9
1 đề trong quyển này.
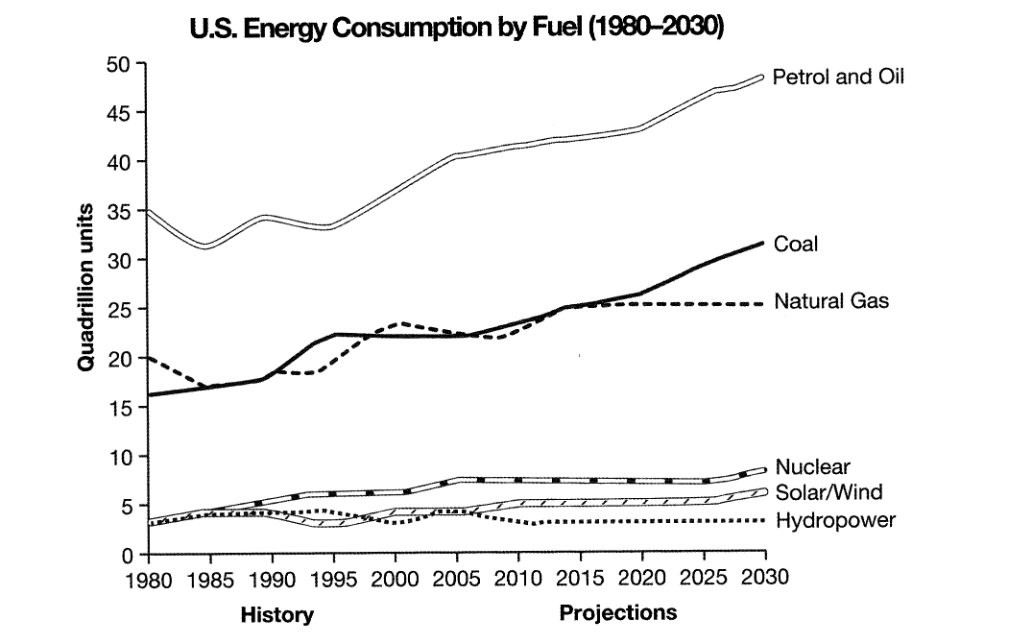
The graph below gives information from a 2008 report about consumption of energy in the USA since 1980 with projections until 2030.
Summarise the information by selecting and reporting the main features, and make comparisons where relevant.
Hình đề Task 1 trong Cambridge IELTS Academic quyển 9 Writing Test 4.
Cambridge IELTS Academic quyển 8
1 đề trong quyển này.
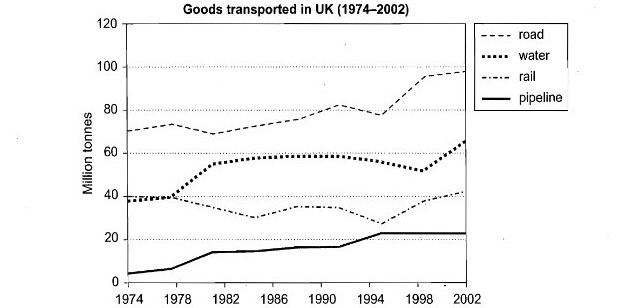
The graph below shows the quantities of goods transported in the UK between 1974 and 2002 by four different modes of transport.
Summarise the information by selecting and reporting the main features, and make comparisons where relevant.
Hình đề Task 1 trong Cambridge IELTS Academic quyển 8 Writing Test 4.
Cambridge IELTS Academic quyển 7
1 đề trong quyển này.
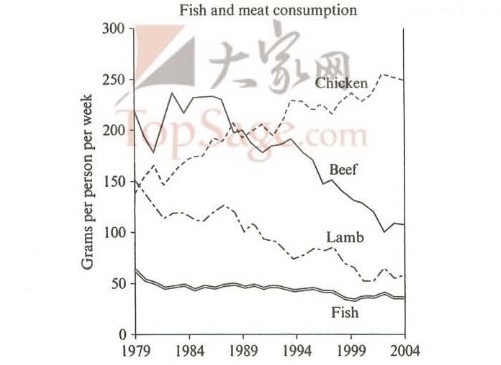
The graph below shows the consumption of fish and some different kinds of meat in a European country between 1979 and 2004.
Summarise the information by selecting and reporting the main features, and make comparisons where relevant.
Hình đề Task 1 trong Cambridge IELTS Academic quyển 7 Writing Test 2.
Cambridge IELTS Academic quyển 5
1 đề trong quyển này.
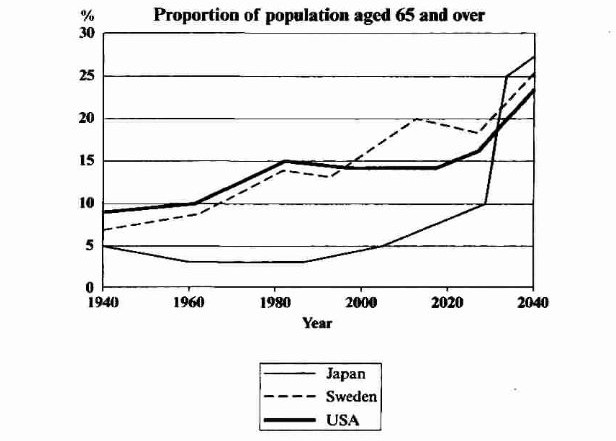
The graph below shows the proportion of the population aged 65 and over between 1940 and 2040 in three different countries.
Summarise the information by selecting and reporting the main features, and make comparisons where relevant.
Hình đề Task 1 trong Cambridge IELTS Academic quyển 5 Writing Test 1.