The graph and table below give information about water use worldwide and water consumption in two different countries. Water Consumption in Brazil and Congo in 2000 Country Population Irrigated land Water consumption per person Brazil 176 million 26,500 km² 359 m³ Democratic Republic of Congo 5.2 million 100 km² 8 m³
Sample Response
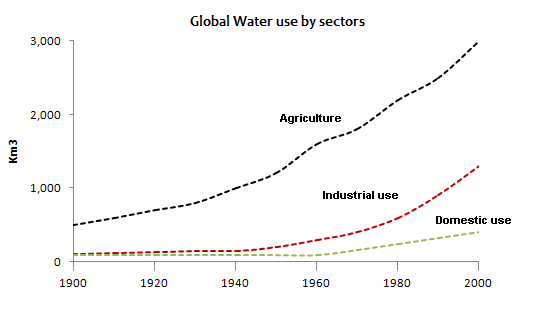
The given graph shows the water consumption in different sectors and how water usage changes rapidly from 1900 to 2000. It also compares the consumption of water in the agriculture sector in two different countries according to their population. Throughout the century, the highest water consumption could be observed in agricultural sector respectively which was initially 500 km³ and rose steadily approximately to 3000 km³ respectively. Usage of water recorded at a minimal level in 1900 and it remained same in half of the century. In 1950 and onwards, water consumption in industrial sector grew significantly to over 1000 km³ while in domestic sector slightly increment in water usages can be seen which was about only 300 km³. The given table illustrates the water consumption in different areas of the world. Irrigated land in Brazil was 26,500 km2 with the population of 176 million and water consumption per person was 359 m³ whereas D.R.C possesses 100 km2 irrigated land with the lowest number of population (only 5.2 million) and they consumed 8 m³ water per person respectively. Moreover, Brazil consumed more water while Congo consumed less water in irrigated lands.
IELTS Writing Correction
- 1. Use past tense Original: how water usage changes rapidly Suggested revision: how water use changed Why it matters: The report describes a completed period ending in 2000, so the verb should be in the past tense.
- 2. Add the article Original: in agricultural sector respectively Suggested revision: in the agricultural sector Why it matters: A singular named sector requires the definite article, and respectively has no paired items here.
- 3. Order adverbs naturally Original: rose steadily approximately to Suggested revision: rose steadily to approximately Why it matters: Approximately should directly modify the final figure.
- 4. Remove respectively Original: 3000 km³ respectively Suggested revision: 3,000 km³ Why it matters: Respectively is not appropriate because this clause gives only one sector and one figure.
- 5. Restore passive verb Original: Usage of water recorded Suggested revision: Water use was recorded Why it matters: The clause needs the auxiliary was to form a complete passive construction.
- 6. Match plural sectors Original: at a minimal level Suggested revision: at minimal levels Why it matters: The statement refers collectively to more than one category of water use.
- 7. Add definite article Original: remained same Suggested revision: remained the same Why it matters: The fixed expression is remained the same.
- 8. Clarify the period Original: in half of the century Suggested revision: during the first half of the century Why it matters: The revision identifies the intended part of the century precisely.
- 9. Use correct time phrase Original: In 1950 and onwards Suggested revision: From 1950 onwards Why it matters: From, rather than in, introduces a starting point that continues forward.
- 10. Add the article Original: in industrial sector Suggested revision: in the industrial sector Why it matters: The named singular sector requires the definite article.
- 11. Add the article Original: in domestic sector Suggested revision: in the domestic sector Why it matters: The named singular sector requires the definite article.
- 12. Correct noun phrase Original: slightly increment in water usages can be seen Suggested revision: a slight increase in water use can be seen Why it matters: Slight must modify the countable noun increase, while water use is normally uncountable.
Suggested Rewrites
- how water usage changes rapidly how water use changed
- in agricultural sector respectively in the agricultural sector
- rose steadily approximately to rose steadily to approximately
- 3000 km³ respectively 3,000 km³
- Usage of water recorded Water use was recorded
- at a minimal level at minimal levels
Why this response received Band 6.5
The response identifies agriculture as the dominant user and reports most headline figures from both visuals, with generally clear sequencing. Its main weakness is imprecision: several statements are ambiguous or mischaracterise the table as agricultural use, and awkward grammatical forms recur. Prioritise a sharper overview that explicitly compares all three sectors, then describe the country figures as population, irrigated land, and per-person consumption without unsupported interpretation.
IELTS Writing Criteria Scores
Task Achievement
The report identifies the dominant sector, describes the broad rises, and presents the table's figures, although some descriptions of what the table measures are inaccurate.
State a precise overview of all three sector trends and compare Brazil with Congo using only population, irrigated land, and per-person consumption.
Coherence and Cohesion
The response progresses logically from the line graph to the table, but vague references and repeated use of "respectively" sometimes blur relationships.
Use clearer paragraphing and explicit subjects for each trend instead of relying on repetitive or ambiguous linking words.
Lexical Resource
There is adequate topic-specific vocabulary for trends and water use, alongside awkward combinations such as "slightly increment" and "lowest number of population."
Refine collocations for describing change and population, such as "rose slightly" and "had the smaller population."
Grammatical Range and Accuracy
A mix of simple and complex structures communicates the main information, but article, agreement, and word-form errors recur throughout.
Check articles, verb forms, and countability in phrases such as "the agricultural sector," "remained the same," and "water use."
Write this task while it is fresh
Try the same task now. It helps you remember the feedback and write better next time.
IELTS Academic Writing Task 1
The graph and table below give information about water use worldwide and water consumption in two different countries. Water Consumption in Brazil and Congo in 2000 Country Population Irrigated land Water consumption per person Brazil 176 million 26,500 km² 359 m³ Democratic Republic of Congo 5.2 million 100 km² 8 m³
Your response
Write the task yourself, then compare your choices with the annotated response.