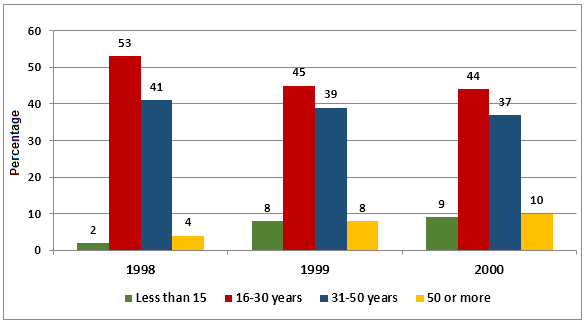
The graph shows Internet Usage in Taiwan by Age Group, 1998-2000. Who Uses the Internet in Taiwan?
Sample Response
The column graph delineates the ratio of Taiwanese internet users based on their ages from the year 1998 to 2000. As is obvious, the majority of the internet users in Taiwan were between 16 and 50 years old during the given period. According to the bar chart, more than half of the Taiwanese internet users in 1998 were young people, between 16 and 30 years old, while another 40% were from 31-50 age group. The remaining 6% were either minors or senior citizens. After a year, more minors and old people in Taiwan embraced this technology as their ratio went as high as 8%. This increase slightly affected the younger internet users’ ratio as their percentages dipped. Next year, in 2000, minor internet users boosted to 9%, a percent fewer than the old internet users over 49 years old. In this year, 16-30 years internet users comprised 44% of the total while 31-50-year-old contributed to another 37% of total internet users in Taiwan.
IELTS Writing Correction
- 1. Name percentage distribution Original: ratio of Taiwanese internet users Suggested revision: percentage distribution of Taiwanese internet users Why it matters: The bars show each age group's share of all users rather than a ratio between two values.
- 2. Use concise category phrase Original: based on their ages Suggested revision: by age group Why it matters: By age group describes the chart's categories more directly and precisely.
- 3. Use overview marker Original: As is obvious Suggested revision: Overall Why it matters: Overall is a concise formal signal for the report's main pattern.
- 4. Correct age expression Original: young people, between Suggested revision: people aged Why it matters: Aged is the natural form before a numerical age range.
- 5. Add article and preposition Original: were from 31-50 age group Suggested revision: were in the 31-50 age group Why it matters: Membership of a named age category is expressed with in the.
- 6. State year directly Original: After a year Suggested revision: In 1999 Why it matters: The exact year is clearer than a relative time reference.
- 7. Use chart category Original: old people Suggested revision: people aged 50 and over Why it matters: The replacement matches the chart's age-group label and avoids an imprecise term.
- 8. Avoid unsupported behaviour Original: embraced this technology Suggested revision: accounted for larger shares of users Why it matters: The chart shows proportions of users, not whether people embraced the technology.
- 9. Clarify both groups Original: their ratio went as high as 8% Suggested revision: each group's share rose to 8% Why it matters: Both the under-15 and 50-plus groups reached 8%, so a singular possessive reference is clearer.
- 10. Remove redundant timing Original: Next year, in 2000 Suggested revision: In 2000 Why it matters: The year already gives the sequence, so Next year is unnecessary.
- 11. Correct trend phrasing Original: minor internet users boosted to 9% Suggested revision: the share of users under 15 rose to 9% Why it matters: A percentage rises, whereas users do not boost to a percentage.
- 12. Use percentage-point difference Original: a percent fewer than Suggested revision: one percentage point lower than Why it matters: The comparison is between 9% and 10%, a difference of one percentage point.
Suggested Rewrites
- ratio of Taiwanese internet users percentage distribution of Taiwanese internet users
- based on their ages by age group
- As is obvious Overall
- young people, between people aged
- were from 31-50 age group were in the 31-50 age group
- After a year In 1999
Why this response received Band 7.0
The response accurately captures the dominance of the two middle age groups and the gradual rise in shares for the youngest and oldest users, using well-chosen figures from all three years. Its main limitation is awkward language in several age-group comparisons and the lack of paragraphing. The priority is to group the overview and detailed trends separately while using precise expressions for percentages and age ranges.
IELTS Writing Criteria Scores
Task Achievement
The overview and supporting figures accurately cover the major proportions and opposing changes across all four age groups from 1998 to 2000.
Refine the comparison by explicitly stating that both middle groups declined while the youngest and oldest groups increased.
Coherence and Cohesion
The report progresses clearly from the overview through 1998, 1999, and 2000, although all information appears in a single paragraph.
Place the overview in its own paragraph and group detailed comparisons by declining middle groups and rising outer age groups.
Lexical Resource
The vocabulary is sufficiently varied for proportions and change, but words such as 'ratio', 'embraced', and 'boosted' are sometimes unnatural in context.
Use precise chart terms such as 'proportion', 'accounted for', 'rose to', and 'fell by one percentage point'.
Grammatical Range and Accuracy
A range of complex sentences communicates the trends, but errors recur in age-group noun phrases, agreement, and comparative forms.
Use consistent forms such as 'users aged 16-30', 'the 31-50 age group', and 'one percentage point lower than'.
Write this task while it is fresh
Try the same task now. It helps you remember the feedback and write better next time.
IELTS Academic Writing Task 1
The graph shows Internet Usage in Taiwan by Age Group, 1998-2000. Who Uses the Internet in Taiwan?
Your response
Write the task yourself, then compare your choices with the annotated response.