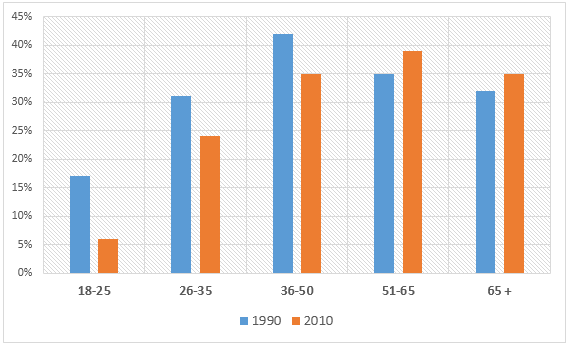
The chart below gives information on the percentage of British people giving money to charity by age range for the years 1990 and 2010.
Sample Response
The chart examines the levels of donation contributions by British people of different ages in two different years - 1990 and 2010. Overall, a greater percentage of British people gave money to charity in 1990 than in 2010 except for the people who were over 50 years old. It is worth noticing that, elder people donated more for charity than their younger counterparts. In 1990, 42% of the 36-50 age-group in Britain made charitable donations, and this figure is the highest on the chart. The 18-25s contributed the least at only 17%. By 2010, these figures had fallen significantly to 35% and 7% respectively. The level of donations from the 26-35 age-group also experienced a decrease in 2010 from 31% to 24%. While donations up to the age of 50 declined across the two years, they rose among the 51-65 age-group from 35% to nearly 40%, which was the highest percentage for 2010. The figure for the over 65s was lower than this, at 35% but it was still a little higher than the 1990's figure of 32%.
IELTS Writing Correction
- 1. Use precise measure Original: levels of donation contributions Suggested revision: percentages making charitable donations Why it matters: The chart shows proportions of people donating rather than levels of money contributed.
- 2. Remove redundancy Original: two different years - 1990 and 2010 Suggested revision: 1990 and 2010 Why it matters: Naming both years already makes the time comparison clear.
- 3. Use concise preposition Original: except for the people Suggested revision: except among people Why it matters: Among is the natural preposition when referring to an age group.
- 4. Fix introductory phrase Original: It is worth noticing that, Suggested revision: Notably, Why it matters: The original construction contains an unnecessary comma after that.
- 5. Correct adjective choice Original: elder Suggested revision: older Why it matters: Elder is not normally used attributively before people in this general comparison.
- 6. Describe percentage correctly Original: donated more for charity Suggested revision: were more likely to donate to charity Why it matters: The chart shows the percentage of donors, not the amount of money donated.
- 7. Add clause comma Original: at 35% but Suggested revision: at 35%, but Why it matters: A comma is needed before but when it joins two independent clauses.
- 8. Remove false possessive Original: 1990's Suggested revision: 1990 Why it matters: The year functions as a modifier here and should not take a possessive apostrophe.
- 9. Organise by function Suggested revision: Separate the introduction and overview from the figures, then group the under-50 declines and over-50 increases into clear detail paragraphs. Why it matters: The single paragraph obscures the otherwise logical overview and comparison structure.
Suggested Rewrites
- levels of donation contributions percentages making charitable donations
- two different years - 1990 and 2010 1990 and 2010
- except for the people except among people
- It is worth noticing that, Notably,
- elder older
- donated more for charity were more likely to donate to charity
Why this response received Band 7.5
The response presents a clear overview, selects all major comparisons, and supports them with accurate figures across both years. Progression is logical and the range of complex structures is strong, though the single-block presentation and several awkward expressions, such as “elder people” and “donated more for charity,” reduce polish. Prioritise conventional paragraphing and more natural data-reporting collocations to make an already well-developed report more precise and fluent.
IELTS Writing Criteria Scores
Task Achievement
The report provides a clear overview and accurately covers the principal changes, peaks, and age-group comparisons in both years.
Refine the broad claim about older donors by specifying that donation rates generally increased with age before peaking in the middle-to-older groups.
Coherence and Cohesion
Ideas progress logically from the overview through younger and older age groups, with cohesive devices used effectively, but the report is presented as one block.
Separate the overview and detailed comparisons into distinct paragraphs to make the information structure more immediately visible.
Lexical Resource
Vocabulary is varied and generally precise for describing proportions and changes, with a few awkward or redundant collocations.
Replace phrases such as “levels of donation contributions” and “elder people” with natural forms such as “donation rates” and “older people.”
Grammatical Range and Accuracy
The response uses a good range of complex sentences with generally strong control, although a few punctuation and possessive-form errors remain.
Remove unnecessary commas after introductory reporting phrases and use forms such as “the 1990 figure” rather than “the 1990's figure.”
Write this task while it is fresh
Try the same task now. It helps you remember the feedback and write better next time.
IELTS Academic Writing Task 1
The chart below gives information on the percentage of British people giving money to charity by age range for the years 1990 and 2010.
Your response
Write the task yourself, then compare your choices with the annotated response.