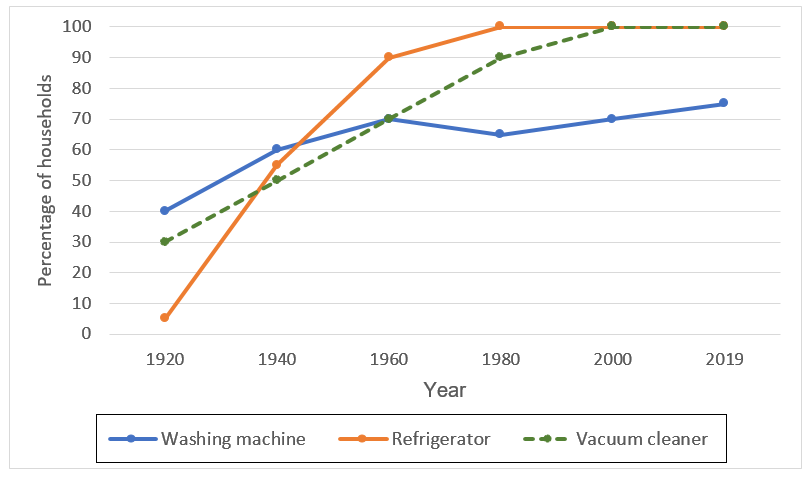
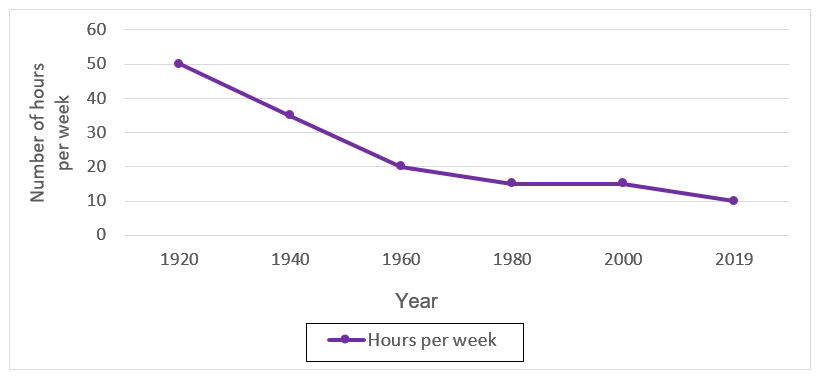
The charts below show the changes in ownership of electrical appliances and the amount of time spent doing housework in households in one country between 1920 and 2019.
Sample Response
The first line graph illustrates the percentage of households that owned electrical appliances - namely washing machines, refrigerators, and vacuum cleaners from 1920 to 2019 in one country. The second graph shows the number of hours spent per week on housework per household during the same period.
Overall, ownership of all three appliances increased over time, with refrigerators and vacuum cleaners experiencing the most dramatic growth, eventually reaching near-universal adoption. Conversely, the average weekly hours spent on housework declined steadily, which shows that increased access to electrical appliances is strongly associated with a marked reduction in household labour over the past century.
In 1920, refrigerators had insignificant ownership in this country, while around 30% of households owned vacuum cleaners and 40% had washing machines. Over the following decades, refrigerator ownership rose sharply, surpassing 90% by 1960 and reaching 100% by 1980. Vacuum cleaner ownership followed a similar trajectory, hitting 100% by 2000. Washing machine ownership grew gradually, climbing to about 70% by 1960 and approximately 75% by 2019.
In contrast, the time spent on housework decreased significantly from 50 hours per week in 1920 to roughly 15 hours in 1980 before levelling off at around 10 hours by 2019. This trend appears inversely related to the growing adoption of household appliances.
IELTS Writing Correction
- 1. Use an em dash Original: appliances - namely Suggested revision: appliances—namely Why it matters: An em dash correctly marks the parenthetical introduction of the appliance list.
- 2. Place location first Original: from 1920 to 2019 in one country Suggested revision: in one country from 1920 to 2019 Why it matters: Placing the location before the period makes the modifiers easier to follow.
- 3. State full adoption Original: near-universal adoption Suggested revision: universal adoption Why it matters: Both refrigerators and vacuum cleaners reach 100% ownership in the chart.
- 4. Correct 1960 figure Original: surpassing 90% by 1960 Suggested revision: reaching 90% in 1960 Why it matters: Refrigerator ownership is exactly 90% in 1960 rather than above it.
- 5. Correct the plateau Original: before levelling off at around 10 hours by 2019 Suggested revision: remaining at 15 hours through 2000 before falling to 10 hours in 2019 Why it matters: The line is flat at 15 hours from 1980 to 2000 and drops to 10 only in 2019.
- 6. Sentence rewrite Original: Conversely, the average weekly hours spent on housework declined steadily, which shows that increased access to electrical appliances is strongly associated with a marked reduction in household labour over the past century. Suggested revision: Conversely, the average weekly hours spent on housework declined substantially as appliance ownership increased over the period. Why it matters: This reports the parallel trends without making a stronger relationship claim than the charts establish.
- 7. Sentence rewrite Original: In 1920, refrigerators had insignificant ownership in this country, while around 30% of households owned vacuum cleaners and 40% had washing machines. Suggested revision: In 1920, refrigerator ownership was very low, at about 5%, while around 30% of households owned vacuum cleaners and 40% had washing machines. Why it matters: Very low accurately describes the measurable refrigerator figure, whereas insignificant is imprecise.
- 8. Sentence rewrite Original: Washing machine ownership grew gradually, climbing to about 70% by 1960 and approximately 75% by 2019. Suggested revision: Washing machine ownership rose from 40% in 1920 to 70% in 1960, dipped to about 65% in 1980, and then recovered to 75% by 2019. Why it matters: The original wording omits the only decline in appliance ownership shown in the chart.
Suggested Rewrites
- appliances - namely appliances—namely
- from 1920 to 2019 in one country in one country from 1920 to 2019
- near-universal adoption universal adoption
- surpassing 90% by 1960 reaching 90% in 1960
- before levelling off at around 10 hours by 2019 remaining at 15 hours through 2000 before falling to 10 hours in 2019
- Conversely, the average weekly hours spent on housework declined steadily, which shows that increased access to electrical appliances is strongly associated with a marked reduction in household labour over the past century. Conversely, the average weekly hours spent on housework declined substantially as appliance ownership increased over the period.
Why this response received Band 8.0
The response presents a strong overview, selects the major changes from both graphs, and develops them in a clear, fluent sequence with precise language. The main limitation is minor loss of accuracy: refrigerator ownership was exactly 90% in 1960, housework hours were flat from 1980 to 2000, and the washing-machine dip is omitted. Prioritise these exceptions and avoid implying a uniformly steady trend when the graph contains a plateau or decline.
IELTS Writing Criteria Scores
Task Achievement
Both graphs are covered with a clear overview and well-selected data, although a few trend details are simplified or slightly inaccurate.
Mention the washing-machine dip from 70% to 65% and the 15-hour plateau between 1980 and 2000, while reporting 1960 refrigerator ownership as exactly 90%.
Coherence and Cohesion
The response is logically sequenced into introduction, overview, appliance trends, and housework trends, with cohesive devices used naturally.
Make the final cross-chart link slightly more concise so the factual description remains the dominant focus.
Lexical Resource
Vocabulary is flexible, precise, and well suited to trend reporting, with only the phrase ‘insignificant ownership’ sounding slightly unnatural.
Replace that phrase with the more exact ‘only 5% of households owned a refrigerator’ and maintain the same quantitative precision elsewhere.
Grammatical Range and Accuracy
A wide range of complex structures is handled accurately, and the response is virtually error-free throughout.
For further refinement, use a comma after the appliance list before ‘from 1920 to 2019’ to prevent momentary attachment ambiguity.
Write this task while it is fresh
Try the same task now. It helps you remember the feedback and write better next time.
IELTS Academic Writing Task 1
The charts below show the changes in ownership of electrical appliances and the amount of time spent doing housework in households in one country between 1920 and 2019.
Your response
Write the task yourself, then compare your choices with the annotated response.