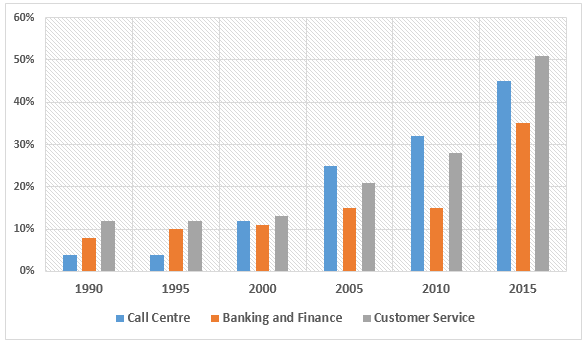
The chart below shows the percentage of female employees in three job sectors in Greece from 1990 to 2015. Percentage of female employees 1990-2015
Sample Response
The bar graph compares the ratio of female employees in three job sectors, namely "call centre", "banking and finance" and "customer service" in Greece from 1990 to 2015. Overall, the percentages of women workers in these sectors skyrocketed and in customer service, the highest ratio of female was employed in 2015. According to the diagram, only 2-3 call centre employees out of a hundred were female in 1990. However, the female operatives in this sector kept on increasing and reached over 20% in 2005 and over 30% in 2010. Finally, in 2015, almost half of the call centre workers were female. A similar trend could be observed in the "banking and finance" and "customer care" sectors. Approximately 9 to 11 per cent of employees in these two sectors were female during 1990 and 2000. However, women participation in these jobs kept on increasing from 2005. In 2015, nearly 35% of Greece women worked in the banking and finance sector. It is worth noticing that the ratio of female employees in customer service in 2015 was more than half of the total employees.
IELTS Writing Correction
- 1. Use the chart measure Original: ratio Suggested revision: percentages Why it matters: Percentages directly matches the chart's stated measure.
- 2. Name the visual correctly Original: diagram Suggested revision: chart Why it matters: Chart is the accurate label for this visual.
- 3. Correct the 1990 figure Original: 2-3 call centre employees out of a hundred Suggested revision: about four call centre employees out of every hundred Why it matters: The 1990 call-centre bar is approximately four percent.
- 4. Use the correct subject Original: female operatives Suggested revision: proportion of female employees Why it matters: The proportion increased, rather than the employees themselves.
- 5. Use concise trend wording Original: this sector kept on increasing Suggested revision: this sector continued to increase Why it matters: Continued to increase is more concise and appropriate for trend reporting.
- 6. Report the value precisely Original: over 20% in 2005 Suggested revision: about 25% in 2005 Why it matters: The call-centre bar for 2005 is approximately twenty-five percent.
- 7. Use the chart estimate Original: over 30% in 2010 Suggested revision: about 32% in 2010 Why it matters: The 2010 call-centre bar is close to thirty-two percent.
- 8. Keep the category label Original: care Suggested revision: service Why it matters: The chart labels this sector customer service.
- 9. Use the possessive form Original: women Suggested revision: women's Why it matters: The plural possessive form is required before participation.
- 10. Refer to sectors Original: jobs Suggested revision: sectors Why it matters: Sectors maintains the chart's category terminology more precisely.
- 11. Use the standard phrase Original: noticing Suggested revision: noting Why it matters: Worth noting is the conventional academic expression.
- 12. Express the proportion clearly Original: the ratio of female employees in customer service in 2015 Suggested revision: women's share of customer-service employees in 2015 Why it matters: The replacement states clearly that the figure is the female share of that sector's workforce.
Suggested Rewrites
- ratio percentages
- diagram chart
- 2-3 call centre employees out of a hundred about four call centre employees out of every hundred
- female operatives proportion of female employees
- this sector kept on increasing this sector continued to increase
- over 20% in 2005 about 25% in 2005
Why this response received Band 6.5
The response gives a clear overview of rising female representation and highlights the leading 2015 figure, with generally logical movement through the sectors. Its main limitation is uneven numerical precision and interpretation, especially the inaccurate early call-centre value and the claim about the proportion of Greek women. The priority is to report each percentage as the share of employees within that sector and check key values carefully.
IELTS Writing Criteria Scores
Task Achievement
The main upward trends and final rankings are identified, but several values are imprecise and one percentage is misinterpreted as a share of Greek women.
State that each figure represents female employees within a sector and verify key years, including the early call-centre values.
Coherence and Cohesion
The information moves logically from the overview to call centres and then the other sectors, but the single paragraph weakens grouping.
Use a separate overview and group the detailed comparisons into two focused body paragraphs.
Lexical Resource
There is sufficient range for trends and comparisons, though expressions such as ratio of female, Greece women, and women participation are awkward.
Prefer precise forms such as proportion of female employees, Greek women, and women’s participation.
Grammatical Range and Accuracy
The response uses both simple and complex structures, but agreement, possessive, and article errors appear in several sentences.
Check noun phrases and agreement carefully, particularly plural references and possessive forms such as women’s participation.
Write this task while it is fresh
Try the same task now. It helps you remember the feedback and write better next time.
IELTS Academic Writing Task 1
The chart below shows the percentage of female employees in three job sectors in Greece from 1990 to 2015. Percentage of female employees 1990-2015
Your response
Write the task yourself, then compare your choices with the annotated response.