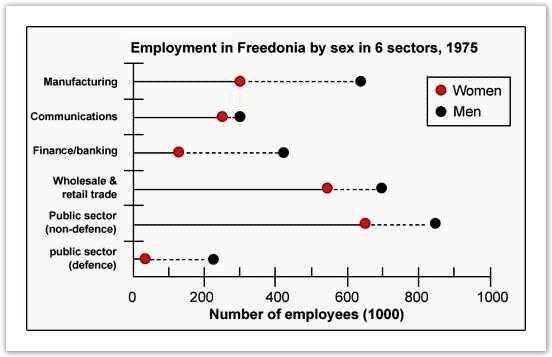
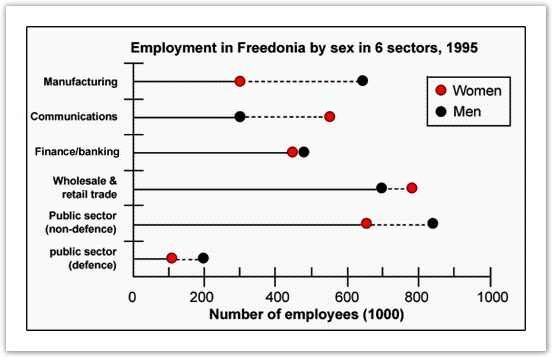
The graphs below show the numbers of male and female workers in 1975 and 1995 in several employment sectors of the Republic of Freedonia. Write a report for a university teacher describing the information shown.
Sample Response
The line graphs show the information about employment scenario in Fredonia by gender in six different employment sectors during 1975 and 1995. It is very clear from the overall trend that men were pretty much dominating the job markets both during 1975 and 1995, but women made progress in the given 20 years period. According to the first graph that depicts the employment status in 1975, there were far more male employees in all the employment sectors than its opposite sex. Nearly half of the employees in the manufacturing industry were men. Most strikingly, 75% of financial sector employees were male. However, women appeared to be competing for shoulder to shoulder against their male counterpart in the communication sectors. Turning to the 1995 data, females had made a significant improvement in securing jobs in different employment sectors. On top of that, women outmatched the male counterpart in securing jobs in communication and wholesale & retail trade industry. Furthermore, nearly half of the communication sector employees were women. In finance sector as well, women were not very far behind. Comparing the two graphs, it seems very clear that in between those twenty years the number of male employees in these sectors had remained considerably the same, but there was a considerable increase of female employees in the majority of these job sectors.
IELTS Writing Correction
- 1. Use concise description Original: the information about employment scenario Suggested revision: employment figures Why it matters: The graph presents numerical employment figures rather than an employment scenario.
- 2. Correct place name Original: Fredonia Suggested revision: Freedonia Why it matters: The country name in the task is Freedonia.
- 3. Use in for years Original: during Suggested revision: in Why it matters: Specific years take the preposition "in."
- 4. Use formal comparison Original: were pretty much dominating Suggested revision: generally outnumbered women in Why it matters: This reports the numerical comparison more formally and precisely.
- 5. Hyphenate time modifier Original: given 20 years period Suggested revision: given 20-year period Why it matters: A compound adjective before a noun uses the singular form and a hyphen.
- 6. Fix comparison target Original: than its opposite sex Suggested revision: than female employees Why it matters: The comparison is between male and female employees, not a sector and its opposite sex.
- 7. Use employment figures Original: status Suggested revision: figures Why it matters: The graph shows numbers of workers rather than employment status.
- 8. Describe numerical rise Original: females had made a significant improvement Suggested revision: female employment had increased significantly Why it matters: Employment figures increase; people do not make an improvement in securing jobs here.
- 9. Use formal transition Original: On top of that Suggested revision: Notably Why it matters: This is a more concise formal transition for a key comparison.
- 10. Use plural comparison Original: the male counterpart in securing jobs Suggested revision: men Why it matters: Women as a group should be compared with men, not a singular counterpart.
- 11. Name sector accurately Original: wholesale & retail trade industry Suggested revision: wholesale and retail trade sector Why it matters: This matches the sector label and avoids the informal ampersand.
- 12. Correct female share Original: Furthermore, nearly half Suggested revision: Furthermore, about two-thirds Why it matters: In 1995, roughly 550,000 of about 850,000 communications workers were women.
Suggested Rewrites
- the information about employment scenario employment figures
- Fredonia Freedonia
- during in
- were pretty much dominating generally outnumbered women in
- given 20 years period given 20-year period
- than its opposite sex than female employees
Why this response received Band 6.0
The response recognises the main twenty-year shift, including women's gains in communications and wholesale and retail, and moves logically from 1975 to 1995. However, it largely replaces the chart's employee counts with inaccurate percentage claims and provides almost no numerical evidence; prioritise reporting representative figures in thousands and checking derived comparisons before adding them, while also using more formal and precise employment vocabulary.
IELTS Writing Criteria Scores
Task Achievement
The main gender shift and several sector comparisons are identified, but key claims use unsupported percentages instead of the employee totals shown and some are inaccurate.
Support the overview with accurate figures, such as women rising from about 250,000 to 550,000 in communications and to 800,000 in wholesale and retail.
Coherence and Cohesion
The chronological movement from 1975 to 1995 is clear and linking is functional, although the single paragraph and repeated overview language limit structure.
Use a separate overview followed by one detail paragraph for each year, ending without repeating the same general trend.
Lexical Resource
The response shows some range in employment vocabulary, but informal and awkward phrases frequently weaken precision.
Replace expressions such as pretty much dominating, opposite sex, and competing shoulder to shoulder against with neutral comparative language.
Grammatical Range and Accuracy
A range of sentence forms conveys the main meaning, but article, preposition, agreement, and noun-form errors occur regularly.
Check articles and number agreement in phrases involving sectors, counterparts, and increases in employment.
Write this task while it is fresh
Try the same task now. It helps you remember the feedback and write better next time.
IELTS Academic Writing Task 1
The graphs below show the numbers of male and female workers in 1975 and 1995 in several employment sectors of the Republic of Freedonia. Write a report for a university teacher describing the information shown.
Your response
Write the task yourself, then compare your choices with the annotated response.