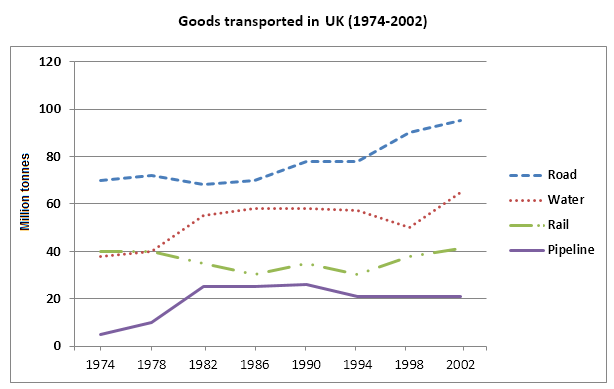
The graph below shows the quantities of goods transported in the UK between 1974 and 2002 by four different modes of transport.
Sample Response
The provided line graph reveals information about the figures for commodities transported in the UK from 1974 until 2002 by using four kinds of transportation. Those transportations were roads, water, rail and pipelines. In general, most of the goods transported via those transportation systems unveiled positive trends which increased gradually for 28 years.
It can be seen that the highest amount of commodities transported was shown by land transportation which was around 70 million tonnes in 1974 to approximately 100 million tonnes in 2002. As a result, it can be stated as a huge improvement among other mentioned transportation. In the second place, there was water transportation which gained about 20 million tonnes of goods in the observed years.
Furthermore, the fluctuation trend came from rail transportation. In 1974, the usage of the train for transporting goods was quite similar to water transportation about 40 million tones; however, during the following years, it gave a tiny increase. Subsequently, pipeline carried the lowest amount of supplies in 1974 which was around 10 million tons. After that, this mode of transport brought promising improvement until in 1994 which remained steadily above 20 million tones.
IELTS Writing Correction
- 1. Use precise measure Original: figures for commodities transported Suggested revision: quantities of goods transported Why it matters: This phrase states the measured quantity more directly and naturally.
- 2. Remove faulty preposition Original: by using Suggested revision: using Why it matters: The means of transport should be introduced with the participle “using” here.
- 3. Use correct term Original: Those transportations Suggested revision: These modes of transport Why it matters: “Modes of transport” is the standard term for road, water, rail, and pipeline.
- 4. Match graph label Original: roads Suggested revision: road Why it matters: The graph labels this mode as singular “Road.”
- 5. Use trend verb Original: unveiled Suggested revision: showed Why it matters: A graph shows trends rather than unveiling them.
- 6. Describe direction clearly Original: positive trends Suggested revision: overall upward trends Why it matters: “Upward” describes the direction more precisely than the evaluative word “positive.”
- 7. Name correct mode Original: land transportation Suggested revision: road transport Why it matters: The highest series in the graph is specifically road transport.
- 8. Use neutral trend Original: huge improvement Suggested revision: substantial increase Why it matters: Task 1 should describe the numerical change neutrally rather than evaluate it as an improvement.
- 9. Fix comparison phrase Original: among other mentioned transportation Suggested revision: compared with the other modes Why it matters: This replacement forms a grammatical comparison with the remaining transport modes.
- 10. Use quantity verb Original: gained Suggested revision: increased by Why it matters: A transport total increases by an amount rather than gaining goods.
- 11. Correct water increase Original: 20 Suggested revision: 27 Why it matters: Water transport rises from roughly 38 to 65 million tonnes, a gain of about 27 million.
- 12. State fluctuation directly Original: the fluctuation trend came from rail transportation Suggested revision: the amount transported by rail fluctuated Why it matters: This wording describes the changing rail total directly and naturally.
Suggested Rewrites
- figures for commodities transported quantities of goods transported
- by using using
- Those transportations These modes of transport
- roads road
- unveiled showed
- positive trends overall upward trends
Why this response received Band 6.0
The response is strongest in its clear overall organization and its identification of roads as the dominant mode and pipelines as the least used. Its main limitation is incomplete and sometimes inaccurate reporting of the trends, particularly for water and rail, alongside frequent awkward collocations and sentence structures. The highest priority is to select accurate start-to-end comparisons for every mode and express them in simpler, controlled sentences.
IELTS Writing Criteria Scores
Task Achievement
A relevant overview and several main features are given, but coverage is uneven and some descriptions of water, rail, and pipeline trends are inaccurate or unclear.
Compare the starting and finishing figures for all four modes accurately, while highlighting the notable fluctuations rather than describing the trends too generally.
Coherence and Cohesion
The response progresses logically from the overview to the individual modes, although some linking expressions and references are mechanical or unclear.
Group roads and water together and rail and pipeline together, using precise comparisons instead of loosely connected commentary.
Lexical Resource
There is an adequate range of transport and trend vocabulary, but frequent awkward collocations reduce precision.
Prefer natural combinations such as goods were transported, rose by, fluctuated, and remained stable instead of forcing less familiar synonyms.
Grammatical Range and Accuracy
The response attempts a mixture of simple and complex forms, but recurring errors with clauses, articles, agreement, and prepositions weaken control.
Build each data sentence around a clear subject and verb, then check articles, plural forms, and relative clauses carefully.
Write this task while it is fresh
Try the same task now. It helps you remember the feedback and write better next time.
IELTS Academic Writing Task 1
The graph below shows the quantities of goods transported in the UK between 1974 and 2002 by four different modes of transport.
Your response
Write the task yourself, then compare your choices with the annotated response.