Browse IELTS Academic Task 1 charts, maps, processes, and diagrams by source and question type.
Source groups
19
Task 1 prompts
80
Question type
Academic
Browse Academic Task 1 by question type
Open focused pages for bar charts, line graphs, tables, pie charts, maps, process diagrams, and mixed charts.
Browse Academic Task 1 by source and book
Jump to a source collection and open each Academic Writing Task 1 prompt with its visual.
Use these Academic Task 1 questions for timed report practice
Each entry keeps the original prompt wording and visual so you can practise selecting key features, making comparisons, and writing a clear 150-word report. More sources can be added to this same Task 1 page over time.
Cambridge IELTS 21 Academic Writing Task 1
4 Academic Writing Task 1 prompts from Cambridge IELTS 21, with the original visual questions.
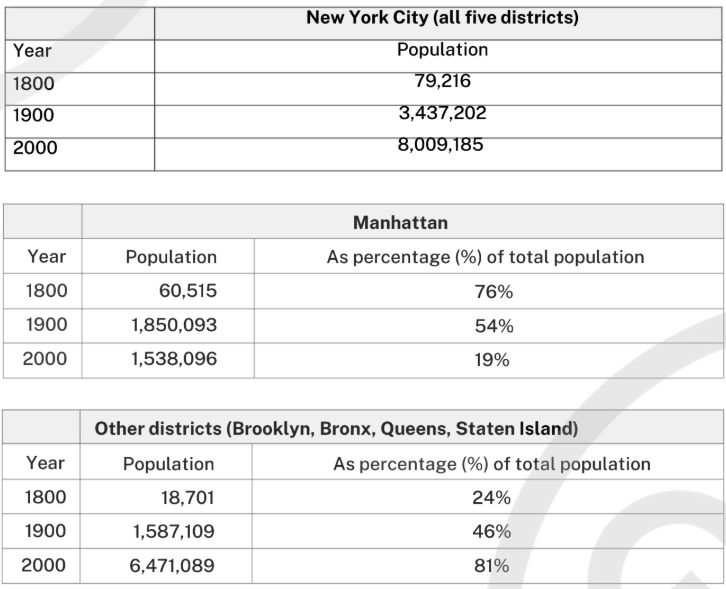
The first table below shows changes in the total population of New York City from 1800 to 2000. The second and third tables show changes in the population of the five districts of the city (Manhattan, Brooklyn, Bronx, Queens, Staten Island) over the same period.
Summarise the information by selecting and reporting the main features, and make comparisons where relevant.
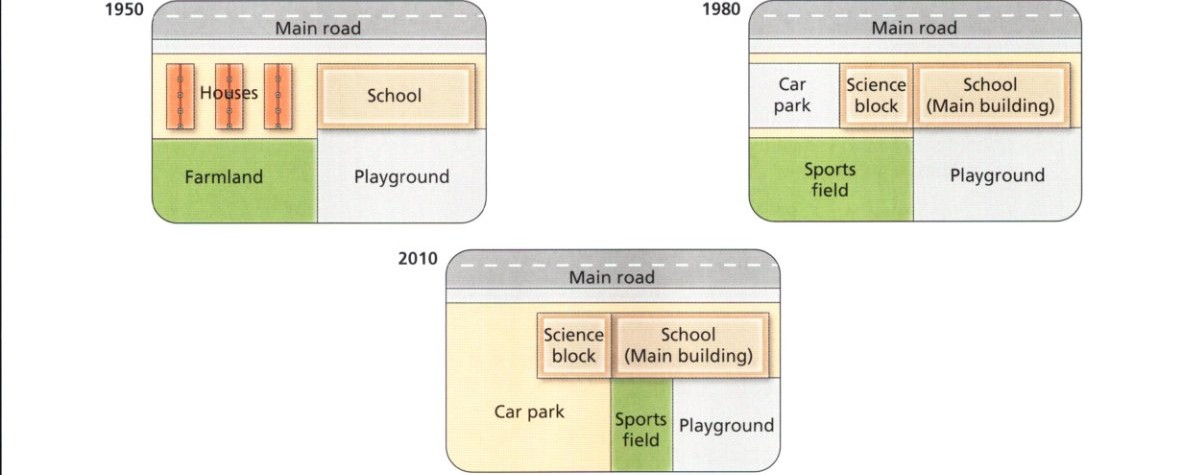
Task 1 visual prompt for Cambridge IELTS 20 Academic Writing Test 1.
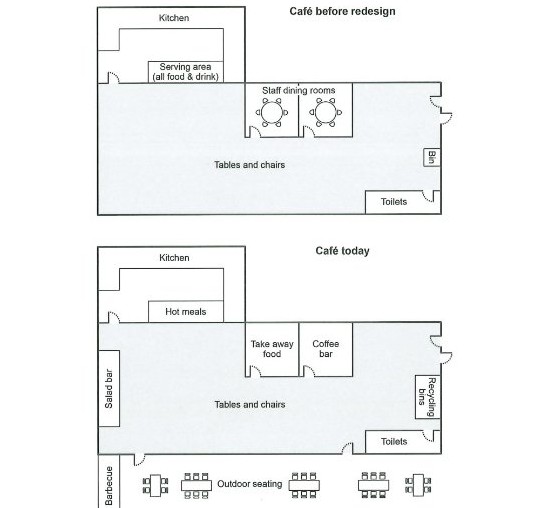
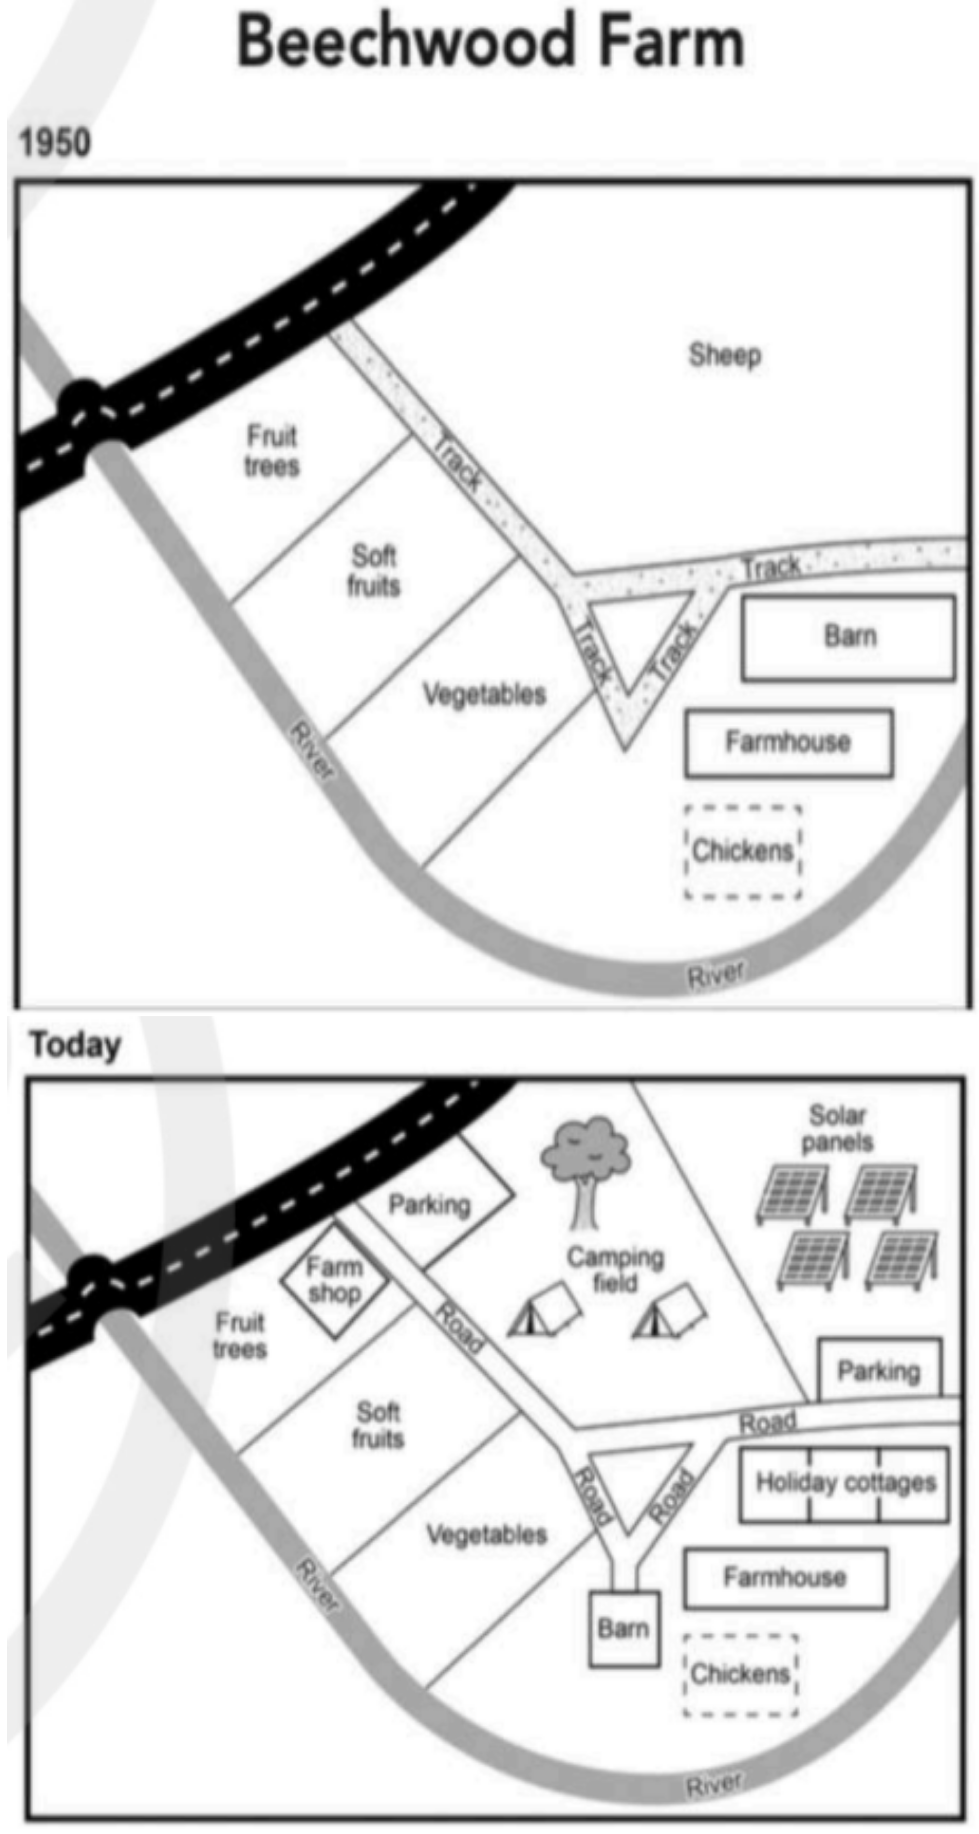
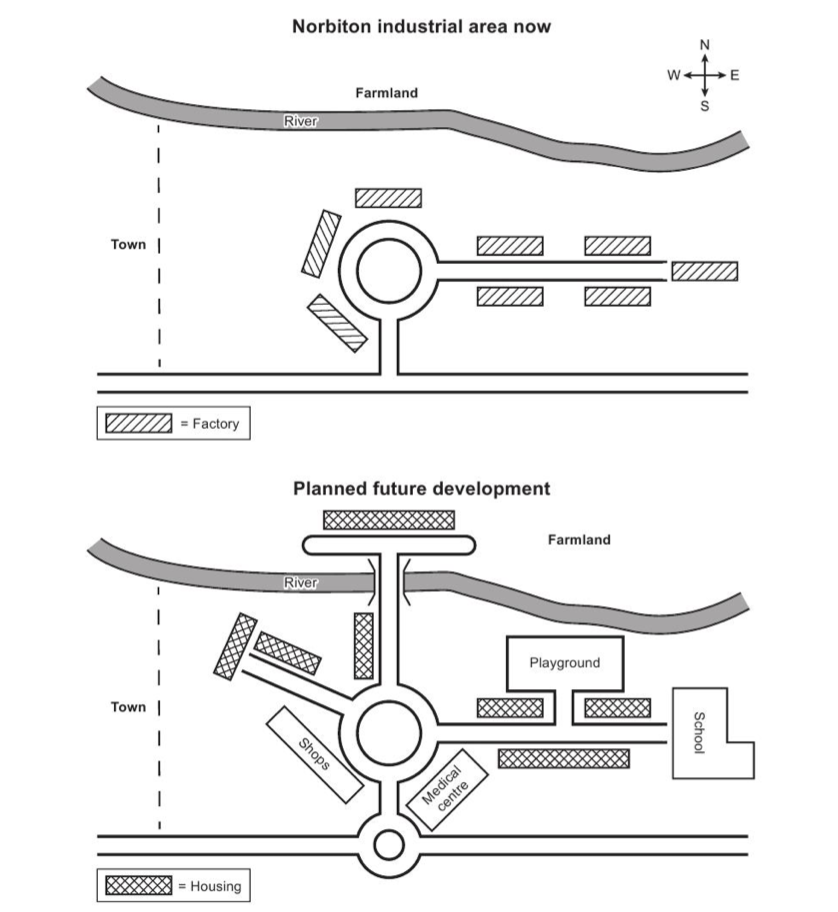
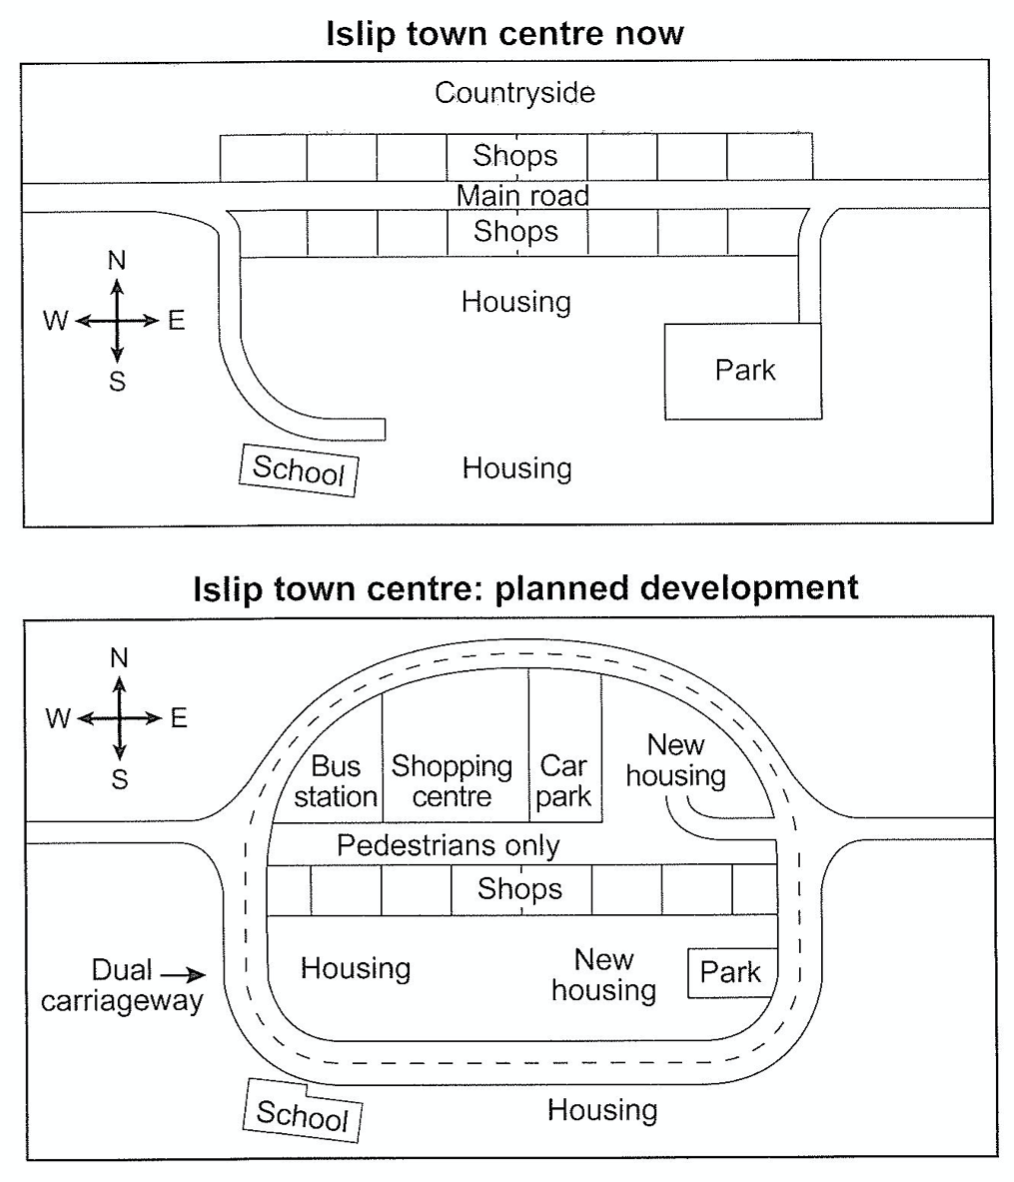
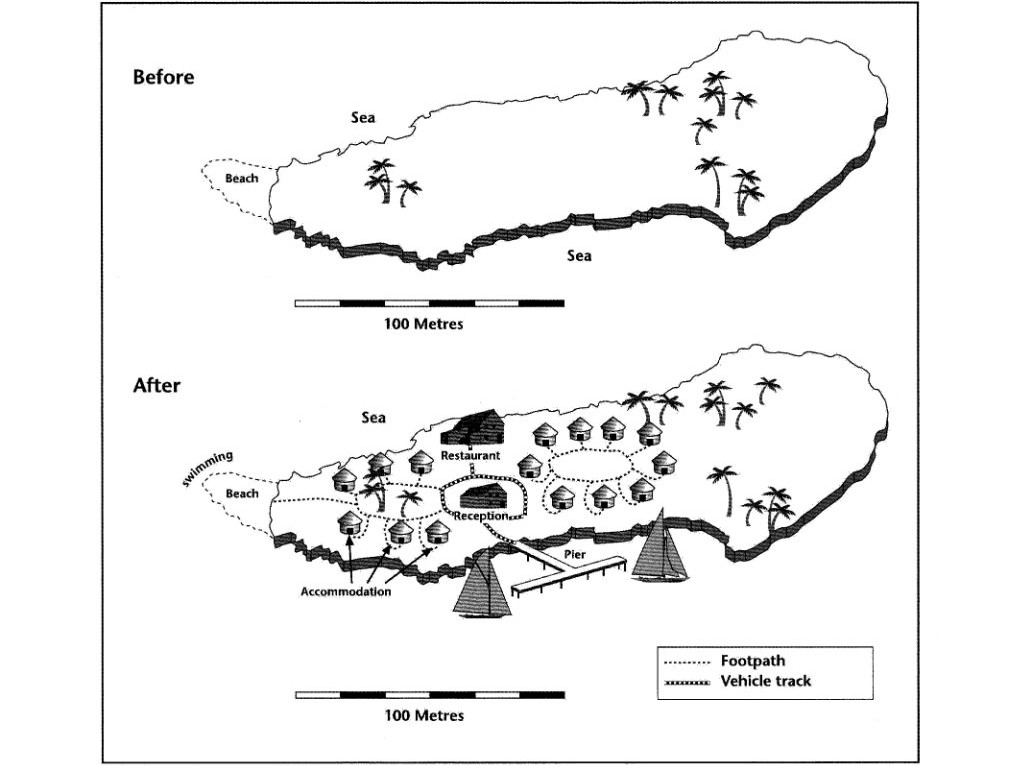
The plans below show the site of a farm in 1950 and the same site today. Summarise the information by selecting and reporting the main features, and make comparisons where relevant.
Task 1 visual prompt for Cambridge IELTS 20 Academic Writing Test 2.
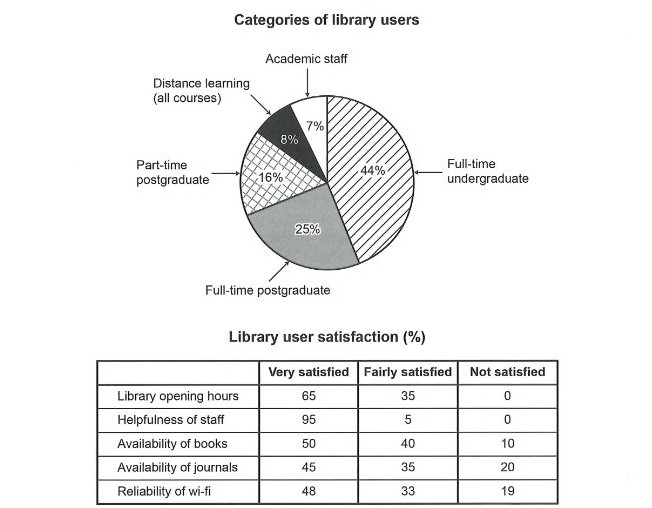
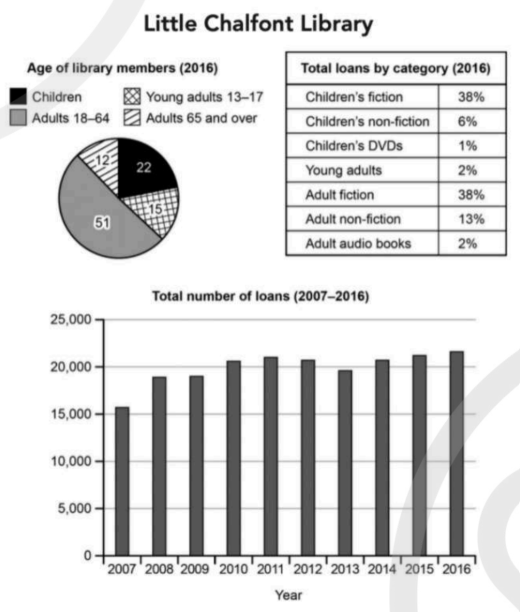
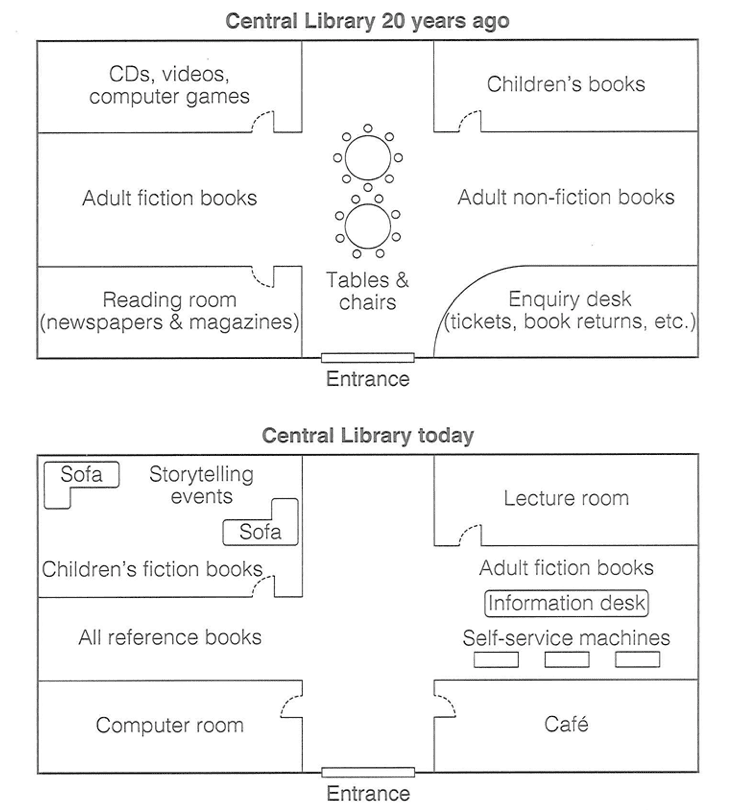
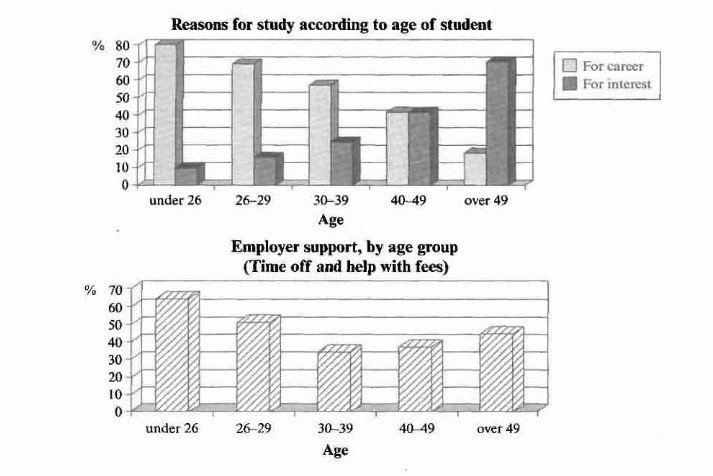
The charts below give information about a public library in a town called Little Chalfont. Summarise the information by selecting and reporting the main features, and make comparisons where relevant.
Task 1 visual prompt for Cambridge IELTS 20 Academic Writing Test 3.
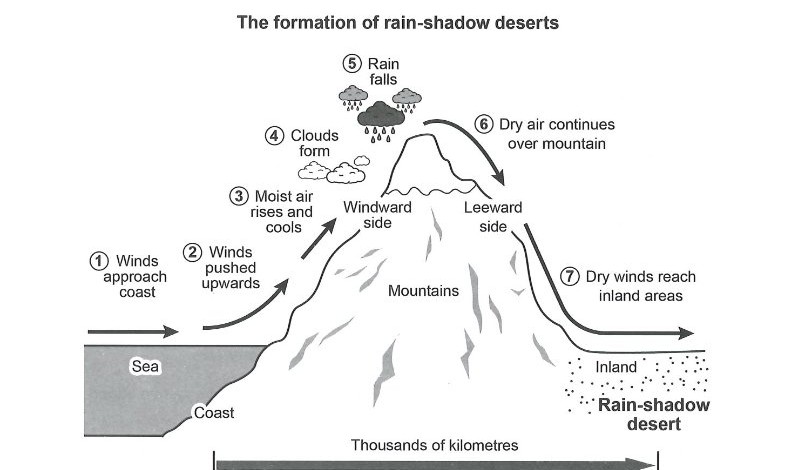
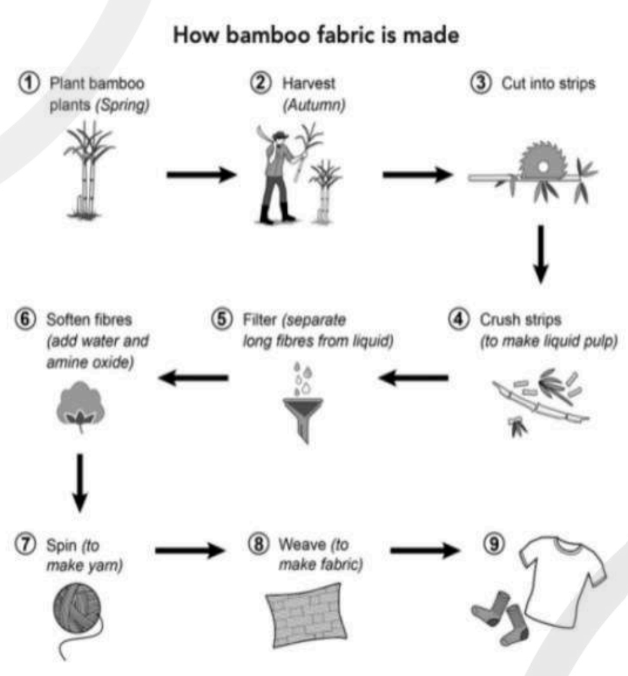
The diagram below shows how fabric is manufactured from bamboo. Summarise the information by selecting and reporting the main features, and make comparisons where relevant.
Task 1 visual prompt for Cambridge IELTS 20 Academic Writing Test 4.
Cambridge IELTS 19 Academic Writing Task 1
4 Academic Writing Task 1 prompts from Cambridge IELTS 19, with the original visual questions.
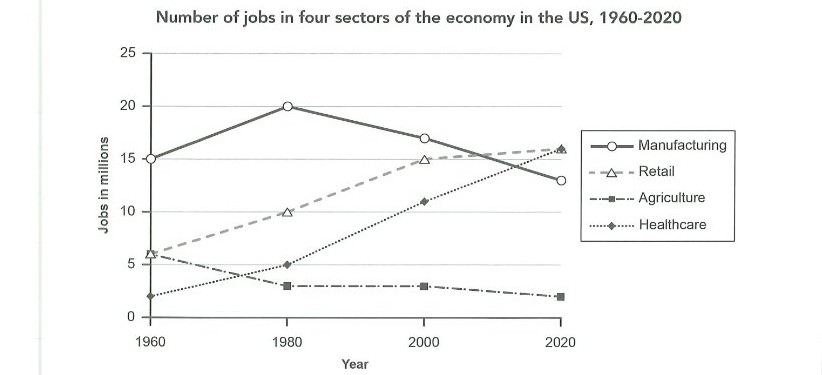
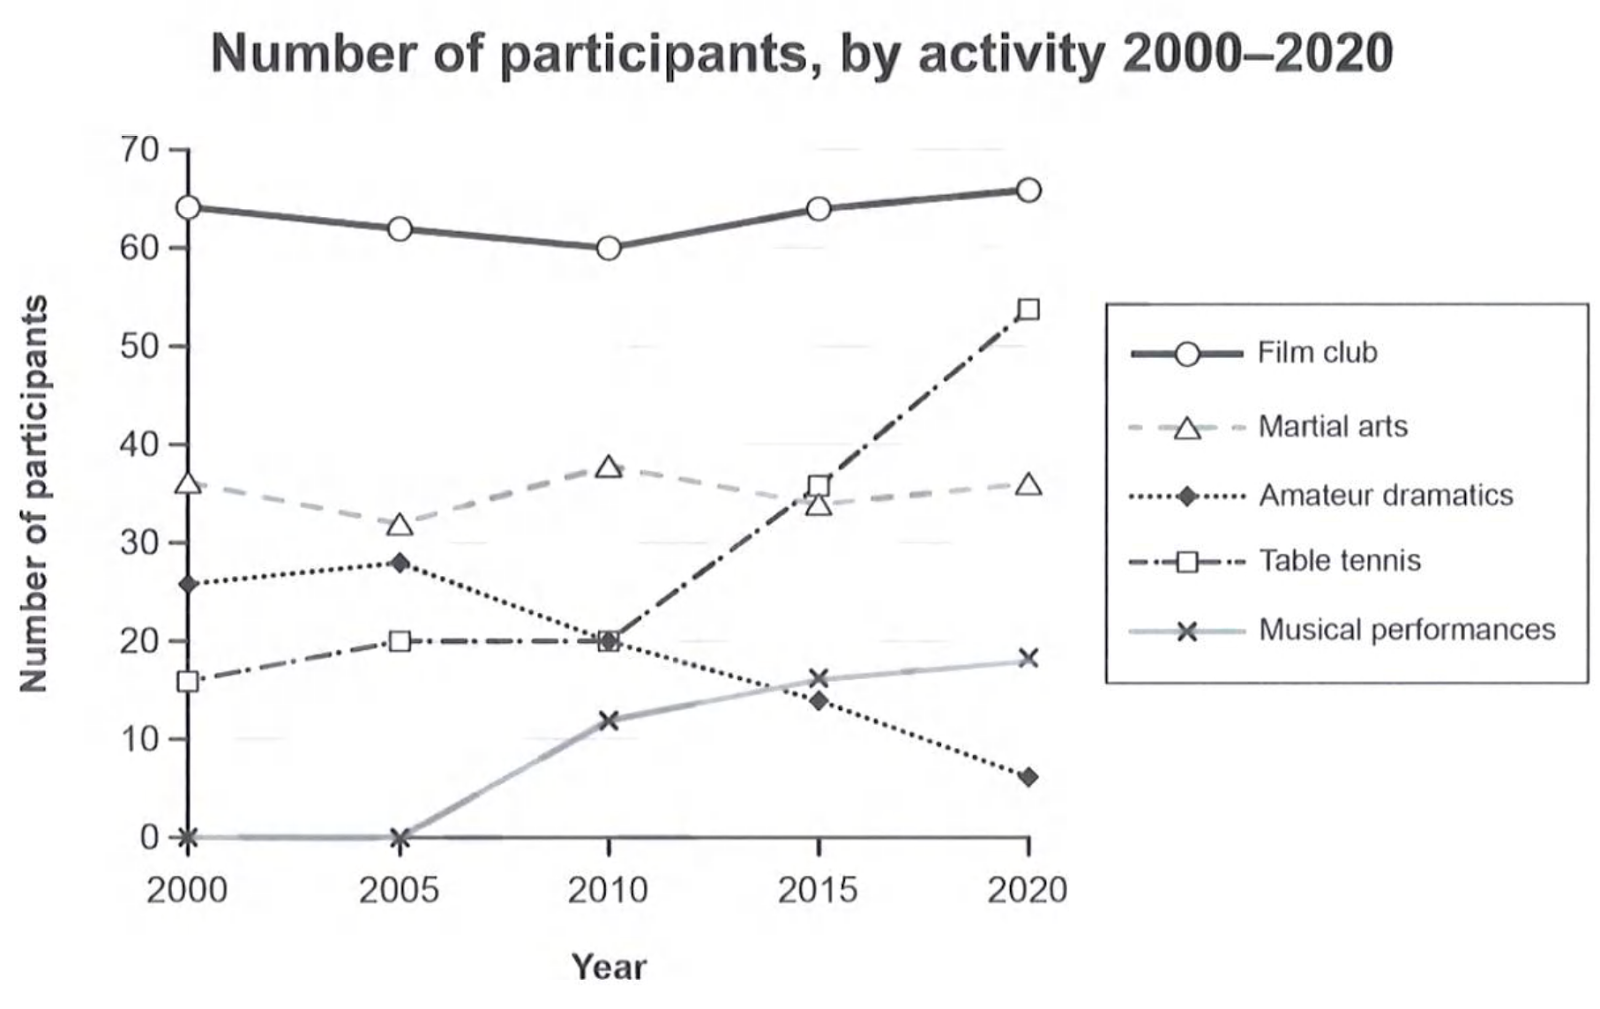
The graph below gives information on the numbers of participants for different activities at one social centre in Melbourne, Australia for the period 2000 to 2020.
Summarise the information by selecting and reporting the main features, and make comparisons where relevant.
Task 1 visual prompt for Cambridge IELTS 19 Academic Writing Test 1.
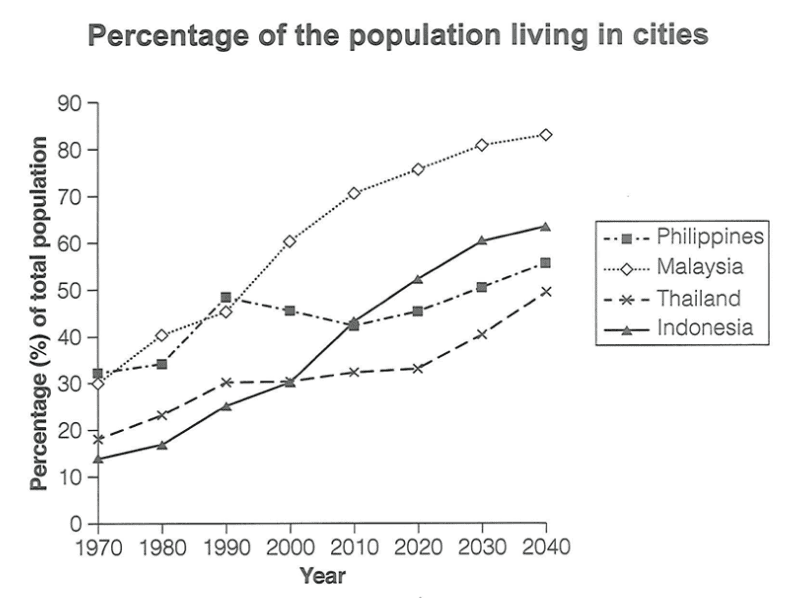
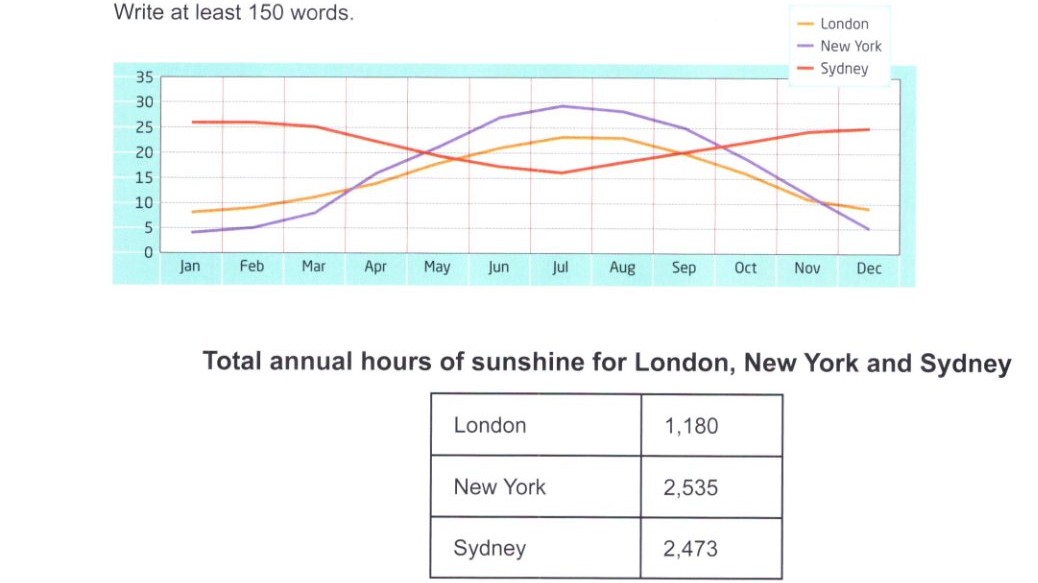
The graph below gives information about the percentage of the population in four Asian countries living in cities from 1970 to 2020, with predictions for 2030 and 2040.
Summarise the information by selecting and reporting the main features, and make comparisons where relevant.
Task 1 visual prompt for Cambridge IELTS 18 Academic Writing Test 1.
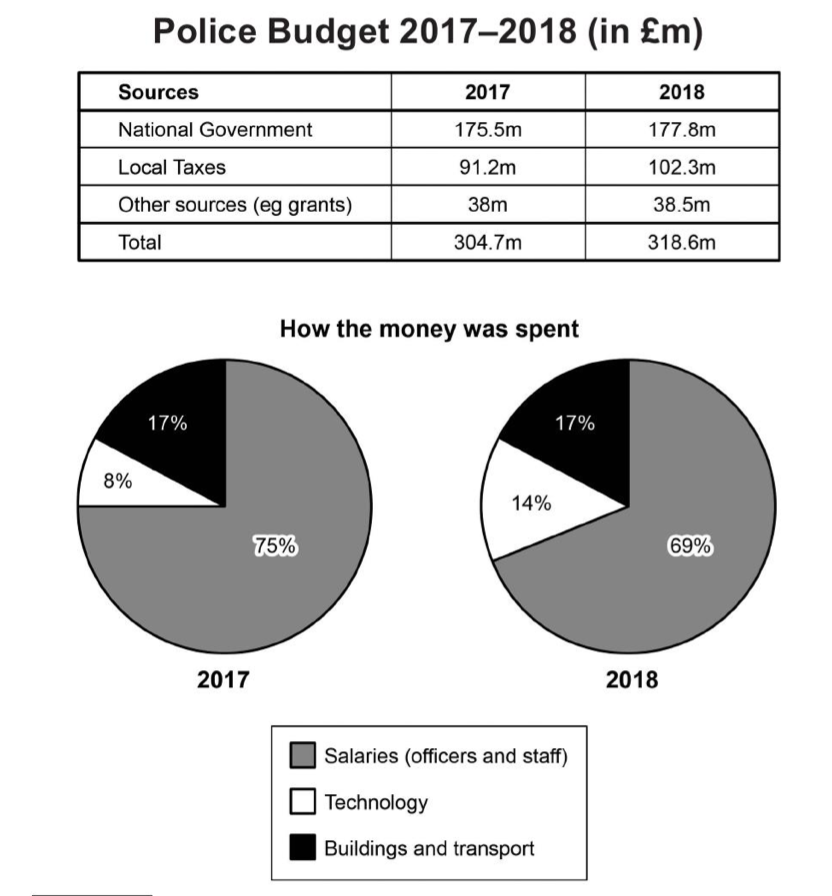
The table and charts below give information on the police budget for 2017 and 2018 in one area of Britain. The table shows where the money came from and the charts show how it was distributed.
Summarise the information by selecting and reporting the main features, and make comparisons where relevant.
Task 1 visual prompt for Cambridge IELTS 17 Academic Writing Test 2.
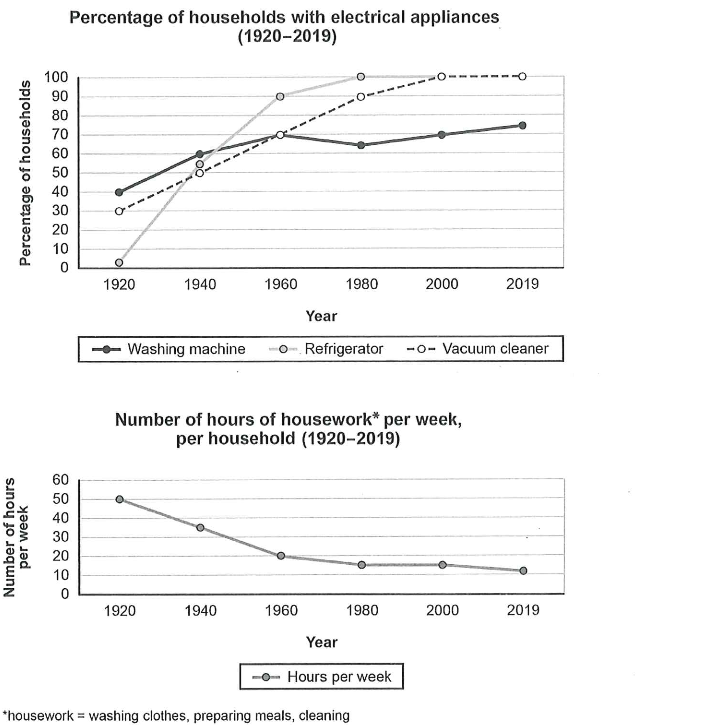
The charts below show the changes in ownership of electrical appliances and amount of time spent doing housework and households in one country between 1920 and 2019.
Summarize the information by selecting and reporting the main features, and make comparisons where relevant.
Task 1 visual prompt for Cambridge IELTS 16 Academic Writing Test 1.
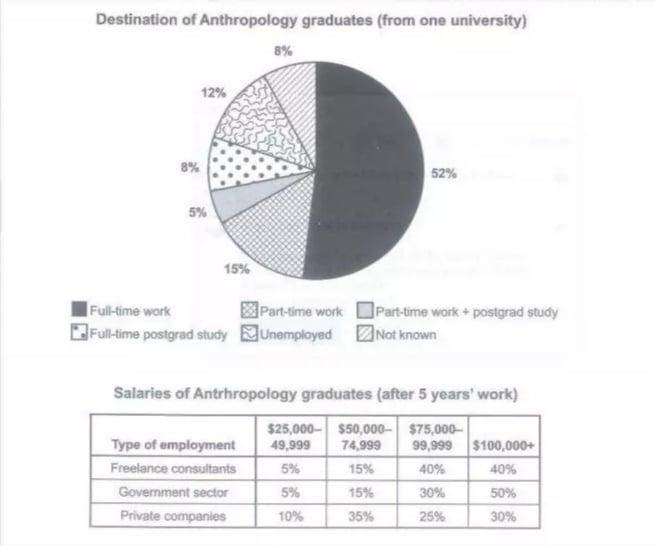
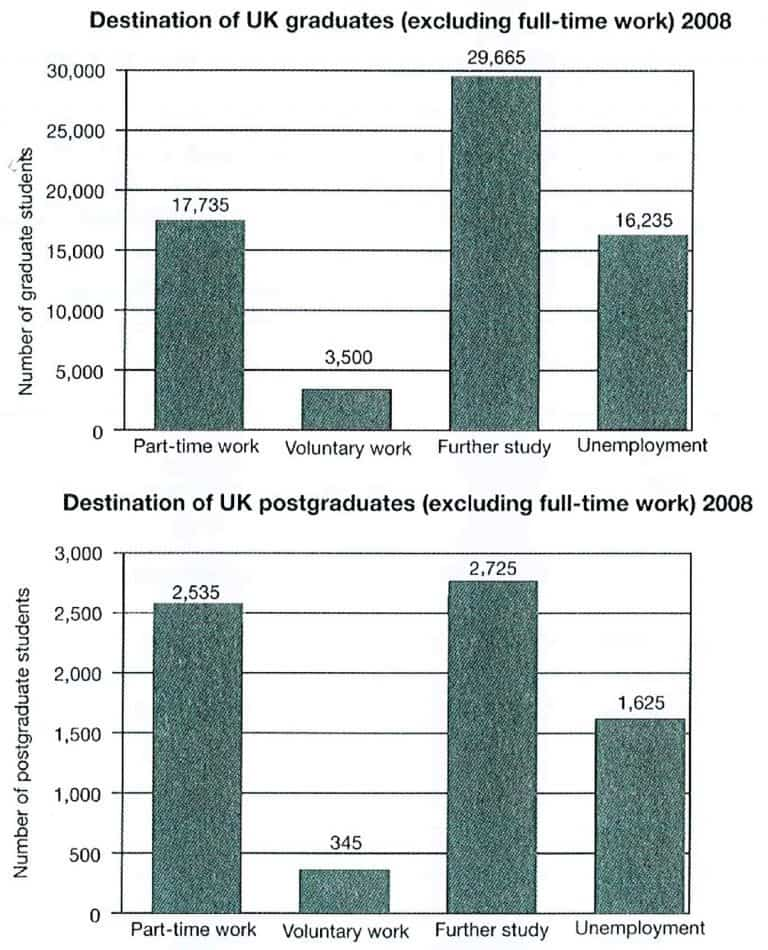
The chart below shows what Anthropology graduates from one university did after finishing their undergraduate degree course. The table shows the salaries of the anthropologists in work after five years.
Summarize the information by selecting and reporting the main features, and make comparisons where relevant.
Task 1 visual prompt for Cambridge IELTS 15 Academic Writing Test 4.
Cambridge IELTS 14 Academic Writing Task 1
4 Academic Writing Task 1 prompts from Cambridge IELTS 14, with the original visual questions.
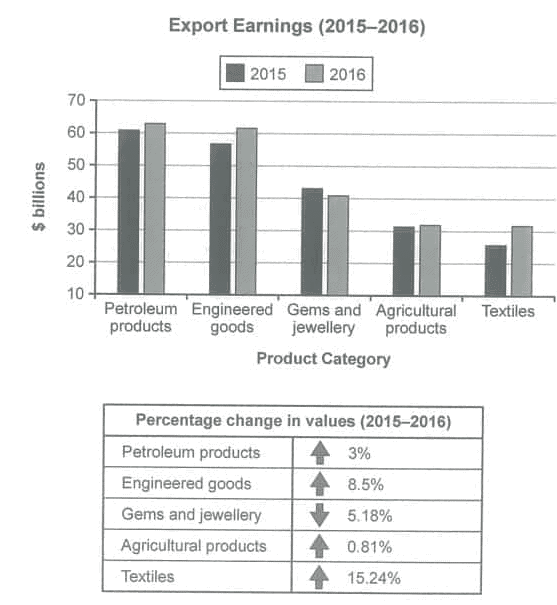
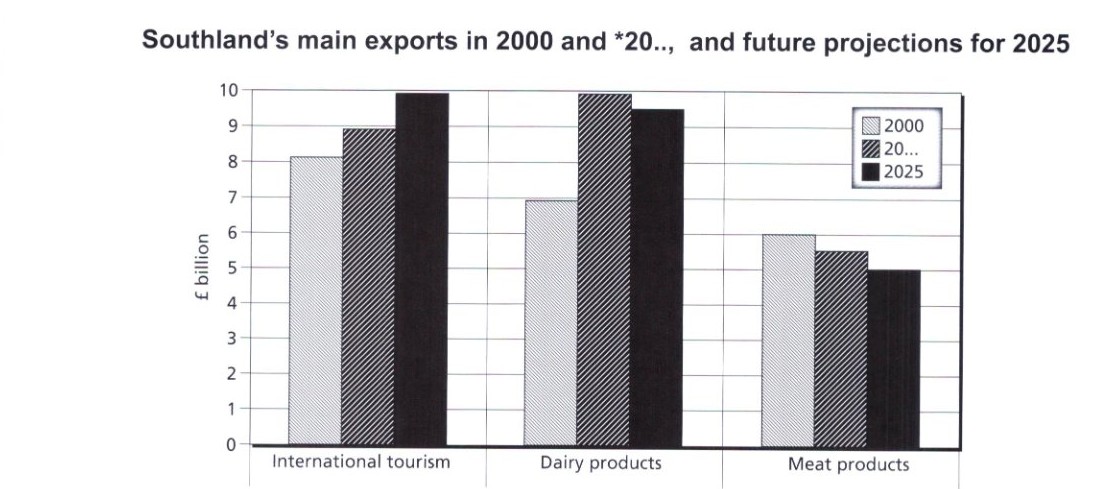
The chart below shows the value of one country’s exports in various categories during 2015 and 2016. The table shows the percentage change in each category of exports in 2016 compared with 2015.
Summarise the information by selecting and reporting the main features and make comparisons where relevant.
Task 1 visual prompt for Cambridge IELTS 14 Academic Writing Test 2.
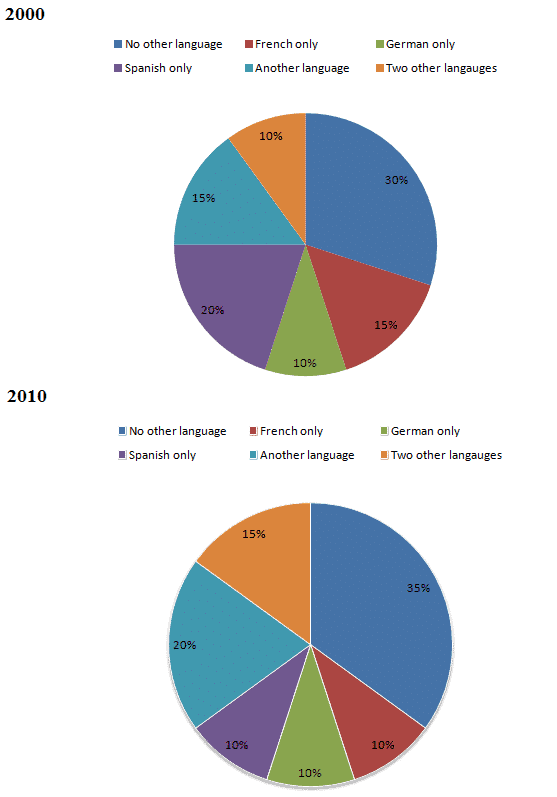
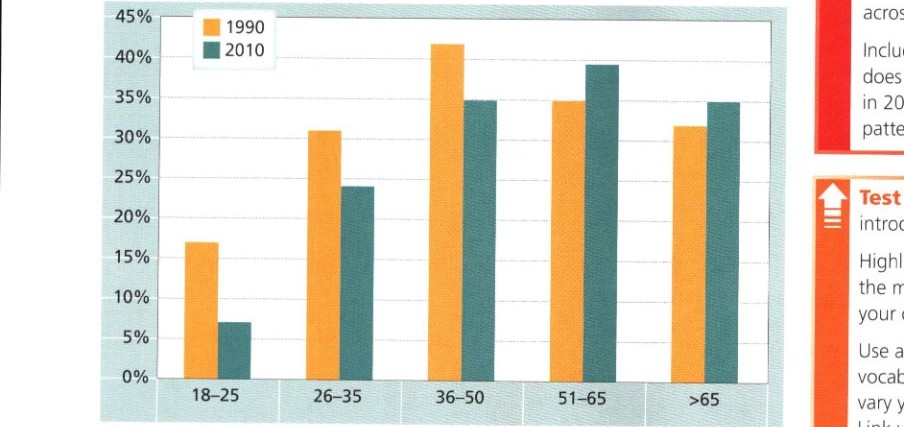
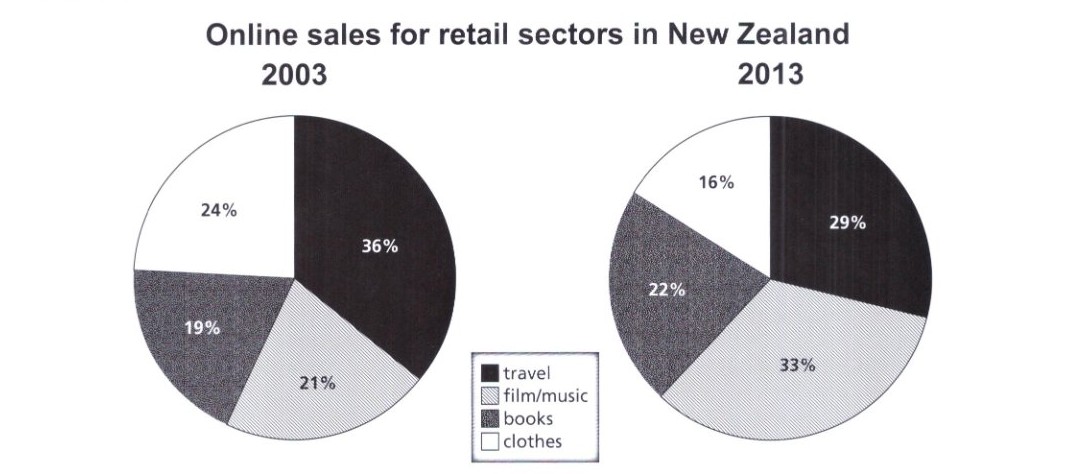
The charts below show the proportions of British students at one university in England who were able to speak other languages in addition to English, in 2000 and 2010.
Summarise the information by selecting and reporting the main features and make comparisons where relevant.
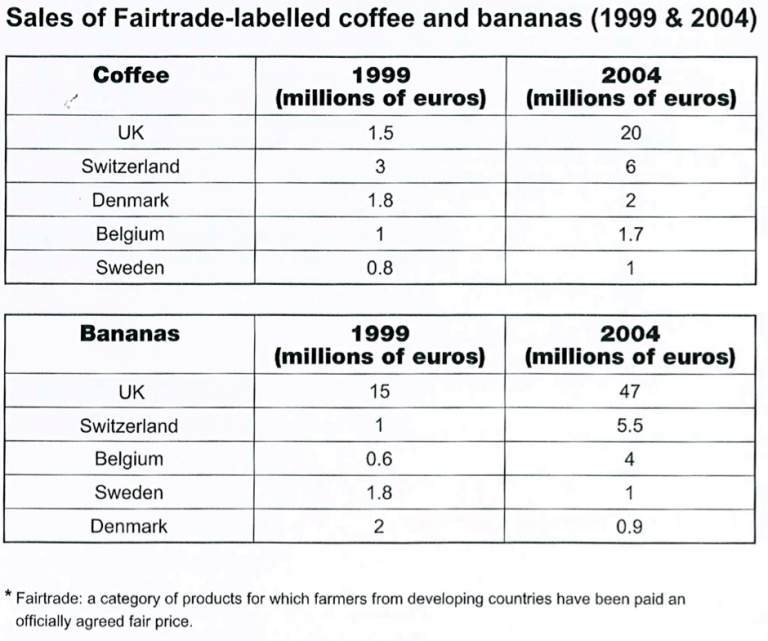
Task 1 visual prompt for Cambridge IELTS 11 Academic Writing Test 2.
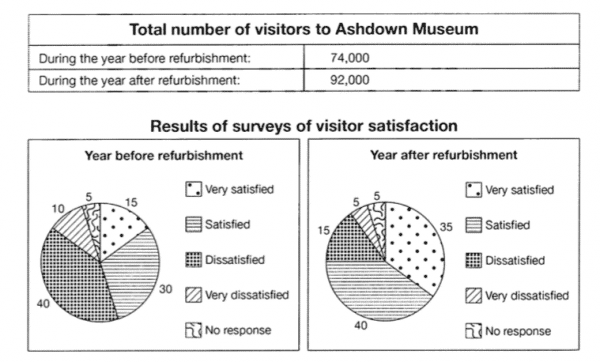
The table below shows the numbers of visitors to Ashdown Museum during the year before and the year after it was refurbished. The charts show the result of surveys asking visitors who satisfied they were with their visit, during the same two periods.
Summarise the information by selecting and reporting the main features and make comparison where relevant.
Task 1 visual prompt for Cambridge IELTS 11 Academic Writing Test 4.
Cambridge IELTS 10 Academic Writing Task 1
4 Academic Writing Task 1 prompts from Cambridge IELTS 10, with the original visual questions.
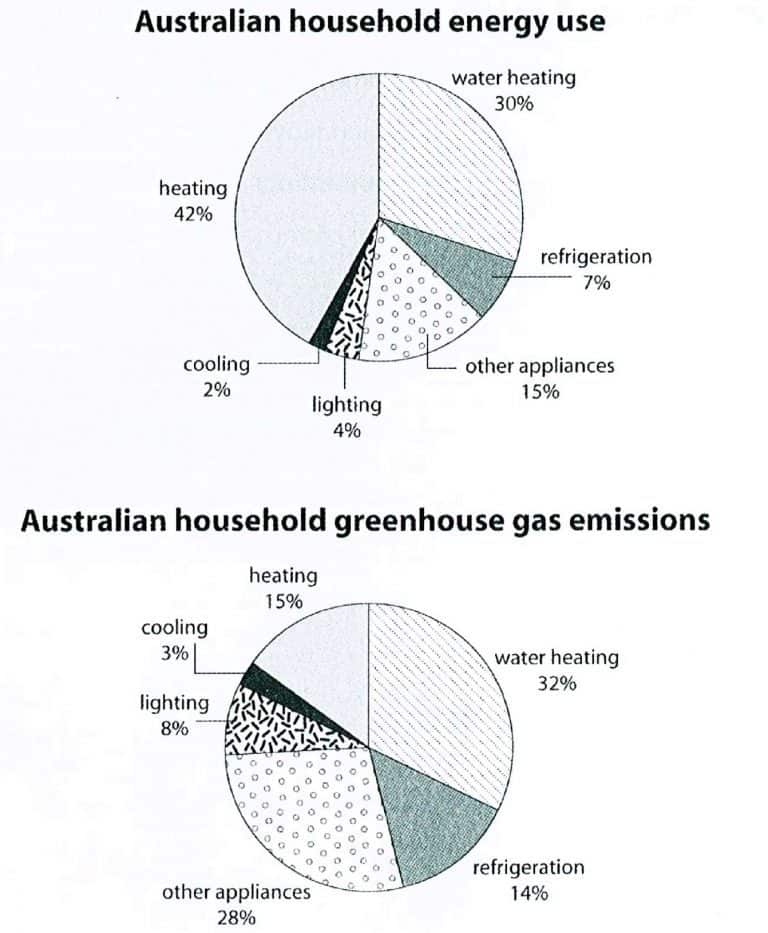
The first chart below shows how energy is used in an average Australian household. The second chart shows the greenhouse gas emissions which result from this energy use.
Summarise the information by selecting and reporting the main features, and make comparisons where relevant.
Task 1 visual prompt for Cambridge IELTS 10 Academic Writing Test 1.
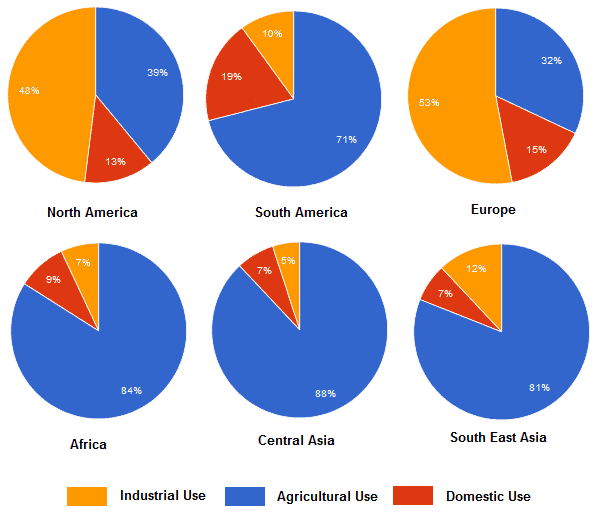
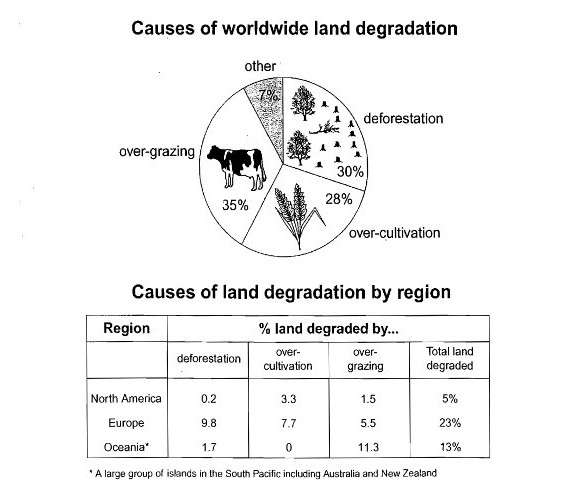
The pie chart below shows the main reasons why agricultural land becomes less productive. The table shows how these causes affected three regions of the world during the 1990s.
Summarise the information by selecting and reporting the main features, and make comparisons where relevant.
Task 1 visual prompt for Cambridge IELTS 8 Academic Writing Test 1.
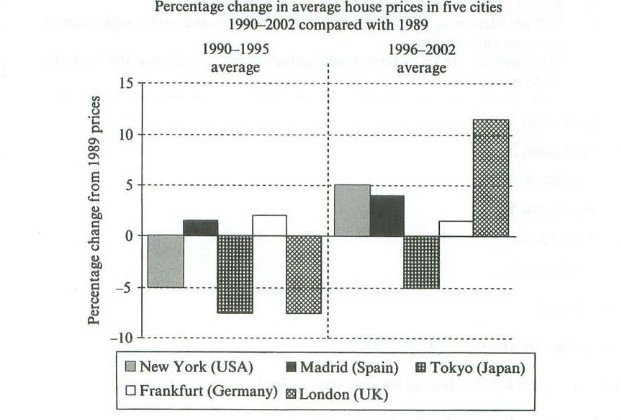
The chart below shows information about changes in average house prices in five different cities between 1990 and 2002 compared with the average house prices in 1989.
Summarise the information by selecting and reporting the main features, and make comparisons where relevant.
Task 1 visual prompt for Cambridge IELTS 7 Academic Writing Test 3.
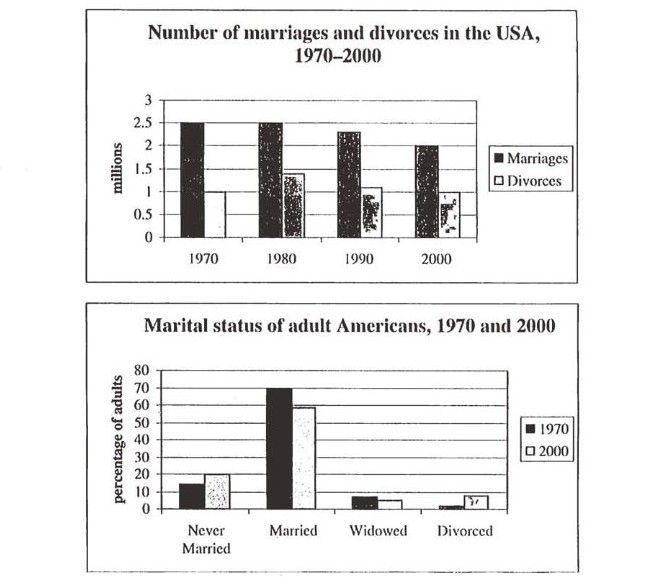
The charts below give information about USA marriage and divorce rates between 1970 and 2000, and the marital status of adult Americans in two of the years.
Summarise the information by selecting and reporting the main features, and make comparisons where relevant.
Task 1 visual prompt for Cambridge IELTS 6 Academic Writing Test 4.
Cambridge IELTS 5 Academic Writing Task 1
4 Academic Writing Task 1 prompts from Cambridge IELTS 5, with the original visual questions.
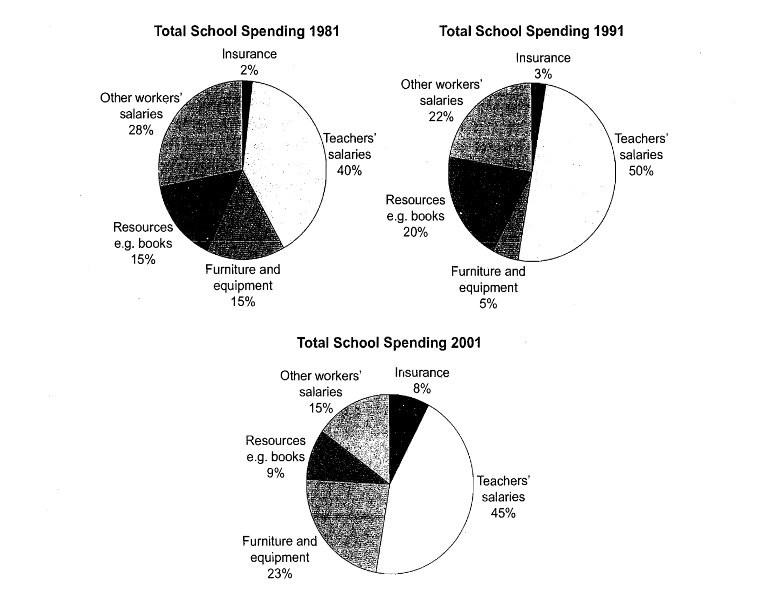
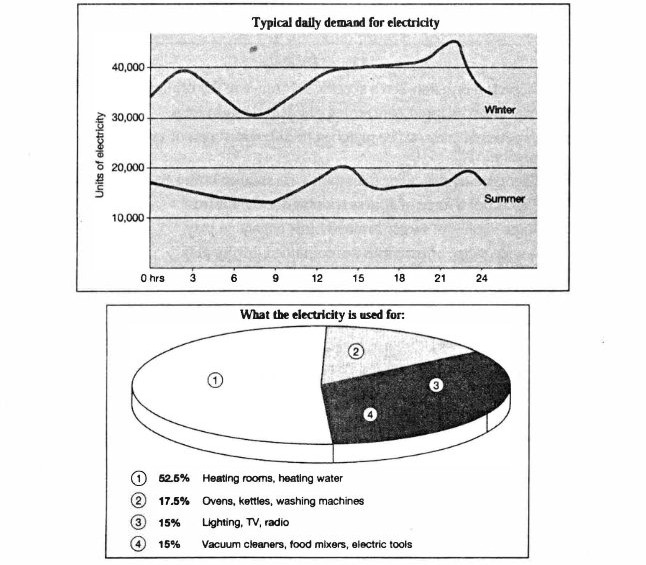
The graph below shows the demand for electricity in England during typical days in winter and summer. The pie chart shows how electricity is used in an average English home.
Summarise the information by selecting and reporting the main features, and make comparisons where relevant.
Task 1 visual prompt for Cambridge IELTS 4 Academic Writing Test 2.