IELTS Academic Writing Task 1
IELTS Academic Task 1 Line Graph Topics
Browse IELTS Academic Task 1 line graph questions from Cambridge IELTS and Official Guide for trend and comparison practice.
Topic type Line graphs
Prompts 11
Source groups 10
Browse Academic Task 1 by question type
Switch between bar charts, line graphs, tables, pie charts, maps, process diagrams, and mixed charts.
Bar charts Browse IELTS Academic Task 1 bar chart questions from Cambridge IELTS and Official Guide for comparison, category, and change practice. Line graphs Browse IELTS Academic Task 1 line graph questions from Cambridge IELTS and Official Guide for trend and comparison practice. Tables Browse IELTS Academic Task 1 table questions from Cambridge IELTS and Official Guide for percentage, ranking, and comparison practice. Pie charts Browse IELTS Academic Task 1 pie chart questions from Cambridge IELTS and Official Guide for proportion and category practice. Maps Browse IELTS Academic Task 1 map and plan questions from Cambridge IELTS and Official Guide for layout and development practice. Processes Browse IELTS Academic Task 1 process questions from Cambridge IELTS and Official Guide for production, cycle, and sequence practice. Mixed charts Browse IELTS Academic Task 1 mixed chart questions from Cambridge IELTS and Official Guide, including chart-table prompts.
Practice line graph topics from real IELTS sources
These line graph prompts are useful for practising trend language, time comparisons, peaks, falls, and overall movement.
Cambridge IELTS Academic Book 21
1 prompt in this book.
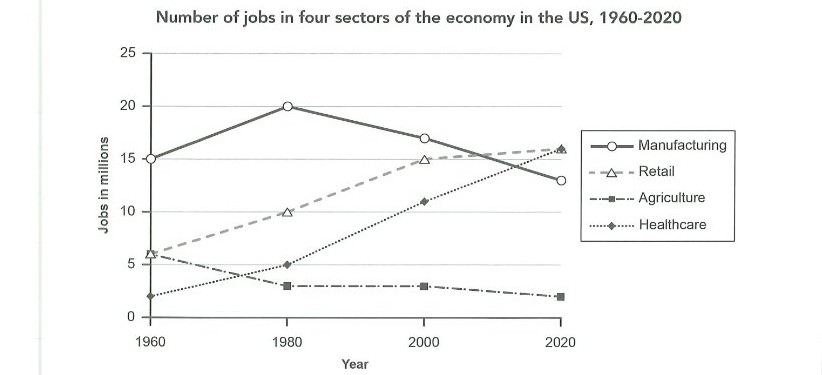
The graph below gives information about the number of jobs in four sectors of the economy in the US between 1960 and 2020.
Summarise the information by selecting and reporting the main features, and make comparisons where relevant.
Task 1 visual prompt for Cambridge IELTS Academic Book 21 Writing Test 1.
Cambridge IELTS Academic Book 19
1 prompt in this book.
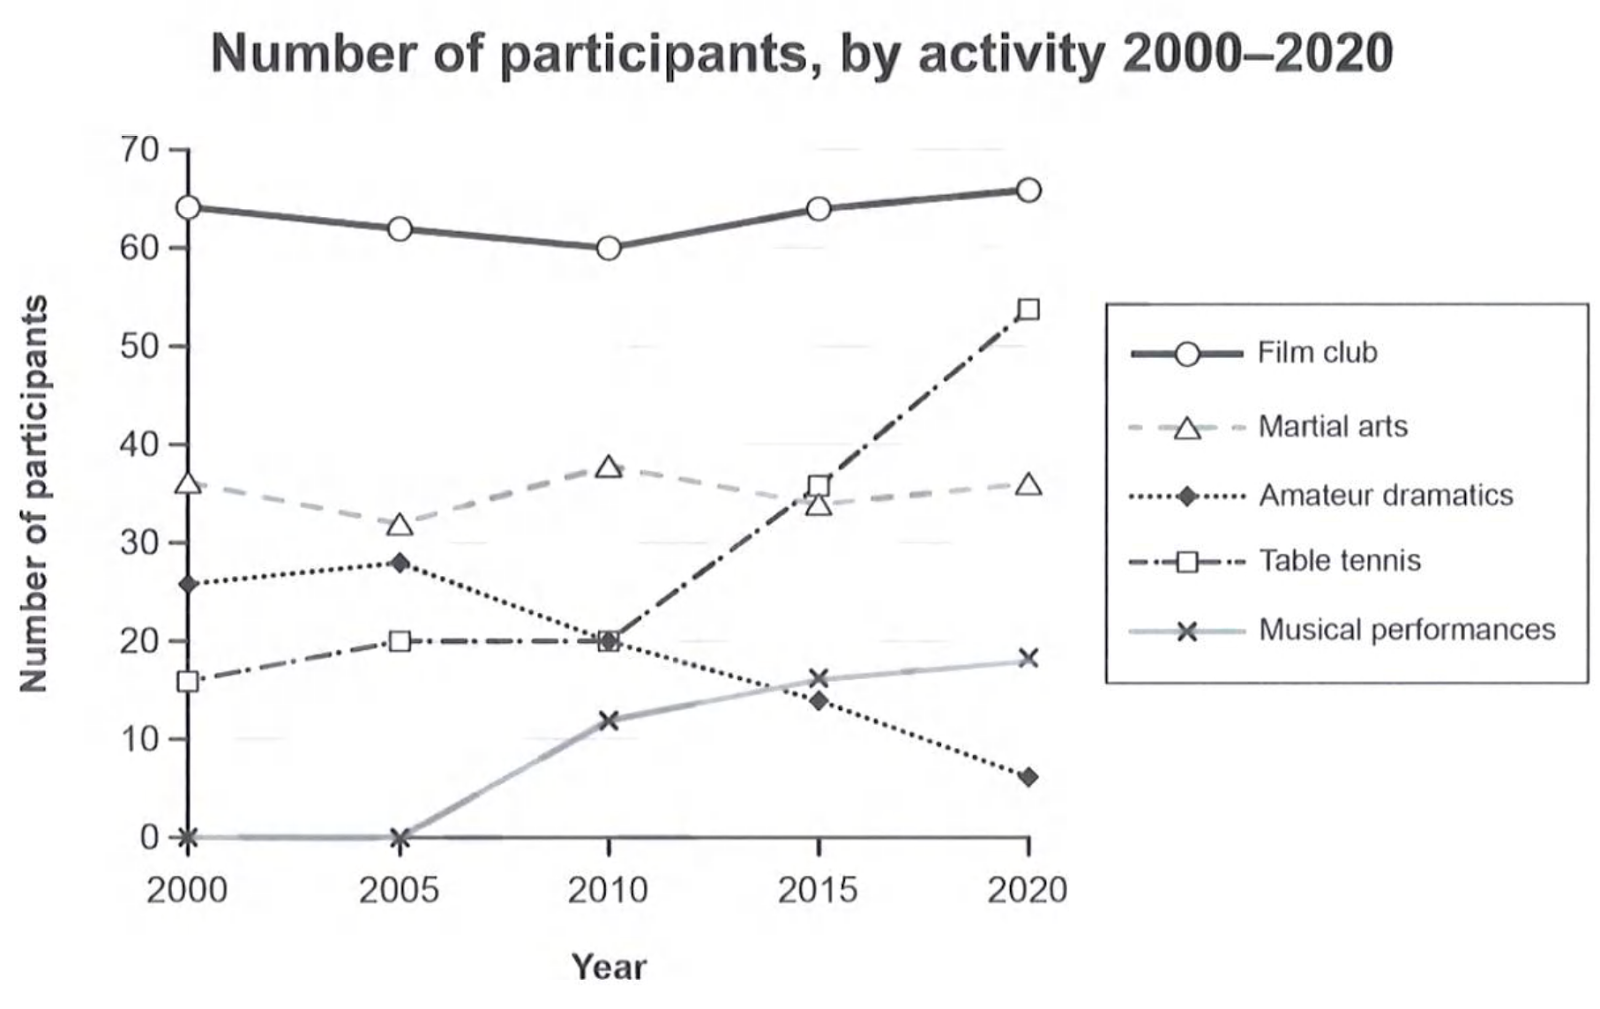
The graph below gives information on the numbers of participants for different activities at one social centre in Melbourne, Australia for the period 2000 to 2020.
Summarise the information by selecting and reporting the main features, and make comparisons where relevant.
Task 1 visual prompt for Cambridge IELTS Academic Book 19 Writing Test 1.
Cambridge IELTS Academic Book 18
2 prompts in this book.
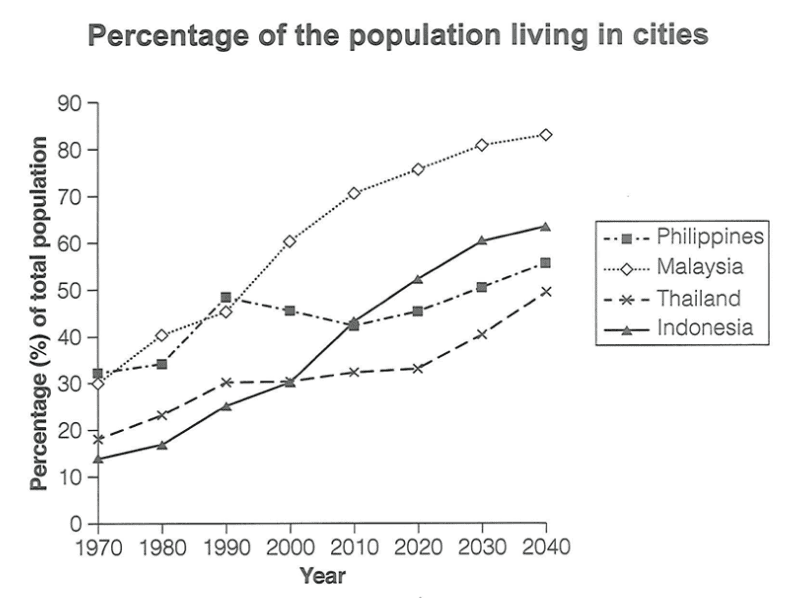
The graph below gives information about the percentage of the population in four Asian countries living in cities from 1970 to 2020, with predictions for 2030 and 2040.
Summarise the information by selecting and reporting the main features, and make comparisons where relevant.
Task 1 visual prompt for Cambridge IELTS Academic Book 18 Writing Test 1.
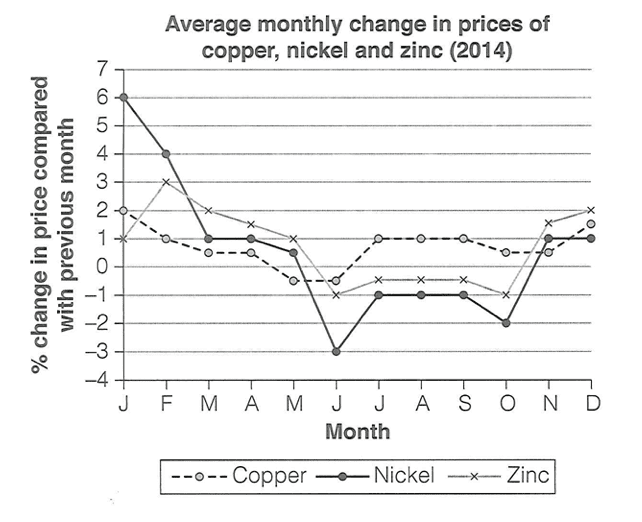
The graph below shows the average monthly change in the prices of three metals during 2014.
Summarise the information by selecting and reporting the main features, and make comparisons where relevant.
Task 1 visual prompt for Cambridge IELTS Academic Book 18 Writing Test 4.
Cambridge IELTS Academic Book 17
1 prompt in this book.
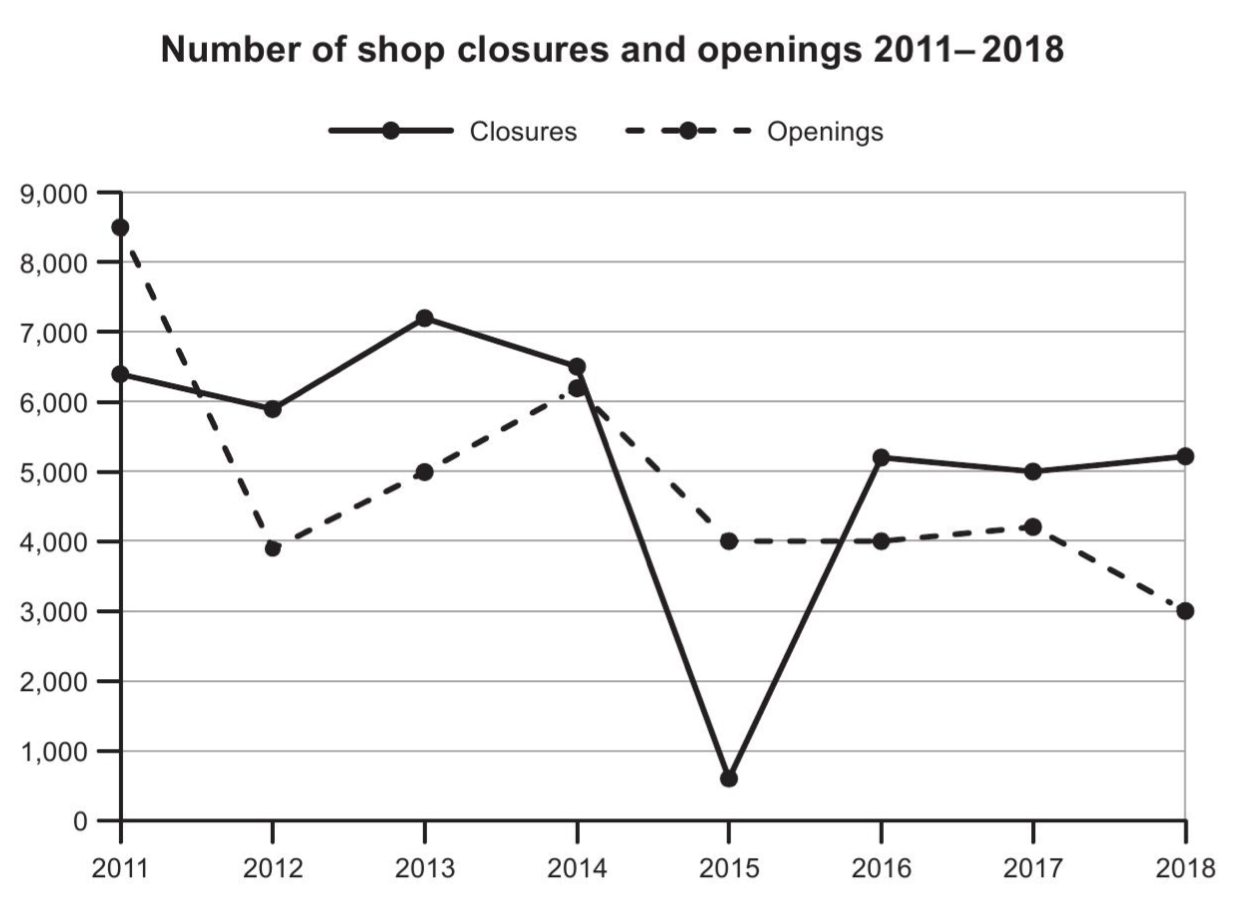
The graph below shows the number of shops that closed and the number of new shops that opened in one country between 2011 and 2018.
Summarise the information by selecting and reporting the main features, and make comparisons where relevant.
Task 1 visual prompt for Cambridge IELTS Academic Book 17 Writing Test 4.
Cambridge IELTS Academic Book 15
1 prompt in this book.
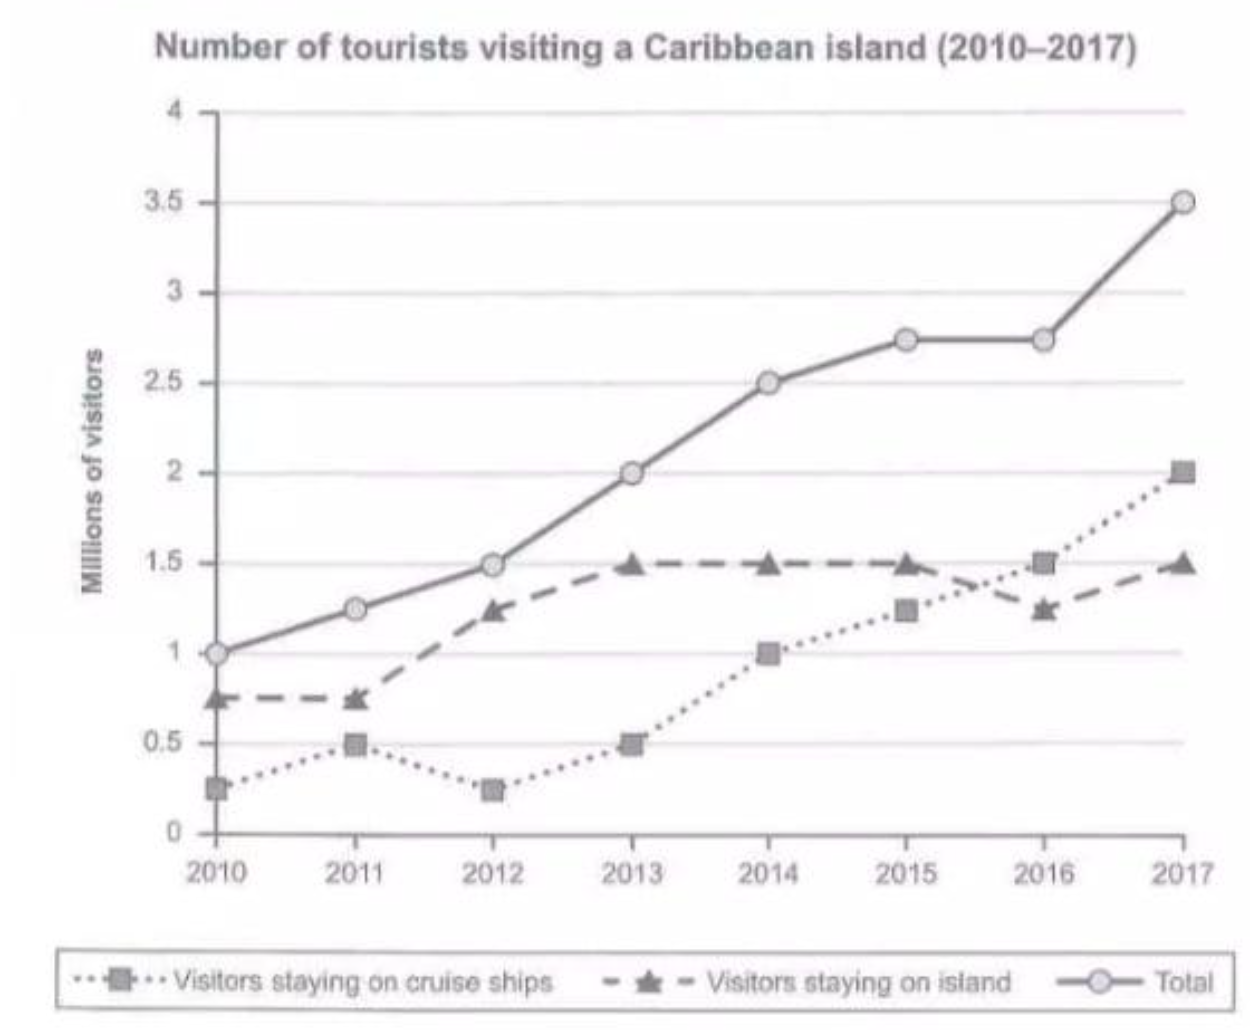
The graph below shows the number of tourists visiting a particular Caribbean island between 2010 and 2017.
Summarize the information by selecting and reporting the main features, and make comparisons where relevant.
Task 1 visual prompt for Cambridge IELTS Academic Book 15 Writing Test 2.
Cambridge IELTS Academic Book 11
1 prompt in this book.
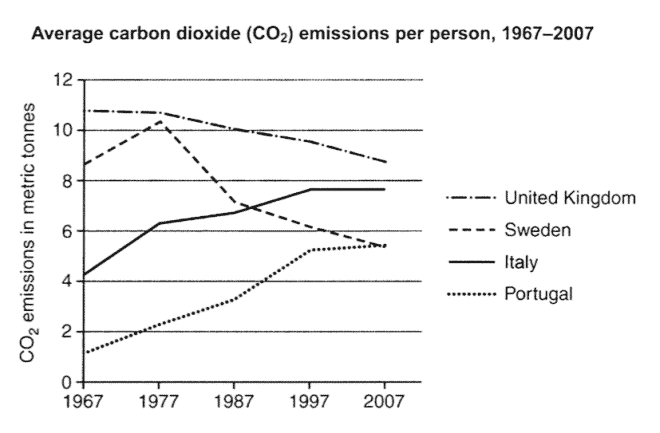
The graph below shows the average carbon dioxide (CO2) emissions per person in the United Kingdom, Sweden, Italy and Portugal between 1967 and 2007.
Summarise the information by selecting and reporting the main features, and make comparisons where relevant.
Task 1 visual prompt for Cambridge IELTS Academic Book 11 Writing Test 3.
Cambridge IELTS Academic Book 9
1 prompt in this book.
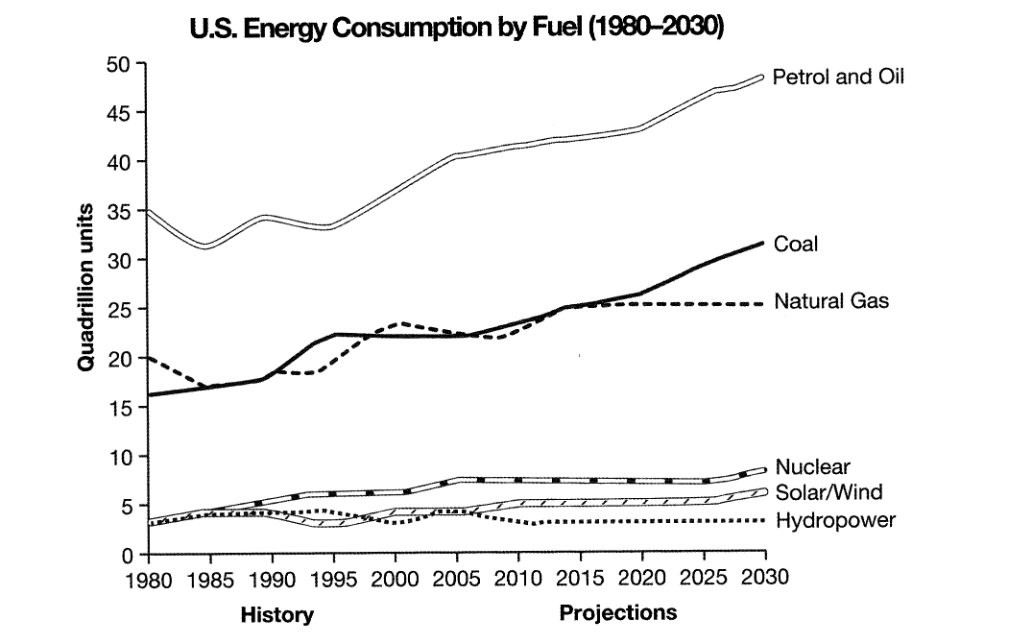
The graph below gives information from a 2008 report about consumption of energy in the USA since 1980 with projections until 2030.
Summarise the information by selecting and reporting the main features, and make comparisons where relevant.
Task 1 visual prompt for Cambridge IELTS Academic Book 9 Writing Test 4.
Cambridge IELTS Academic Book 8
1 prompt in this book.
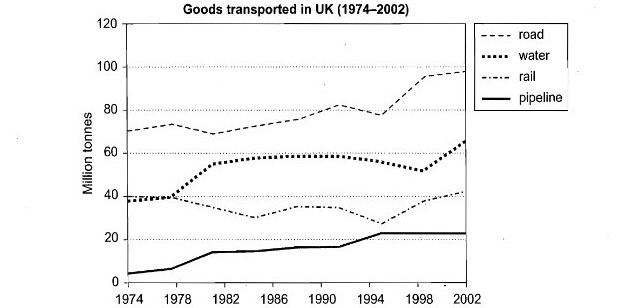
The graph below shows the quantities of goods transported in the UK between 1974 and 2002 by four different modes of transport.
Summarise the information by selecting and reporting the main features, and make comparisons where relevant.
Task 1 visual prompt for Cambridge IELTS Academic Book 8 Writing Test 4.
Cambridge IELTS Academic Book 7
1 prompt in this book.
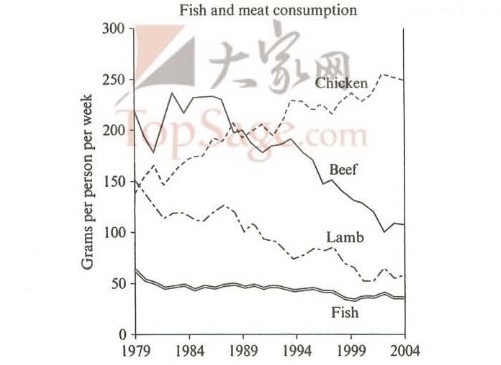
The graph below shows the consumption of fish and some different kinds of meat in a European country between 1979 and 2004.
Summarise the information by selecting and reporting the main features, and make comparisons where relevant.
Task 1 visual prompt for Cambridge IELTS Academic Book 7 Writing Test 2.
Cambridge IELTS Academic Book 5
1 prompt in this book.
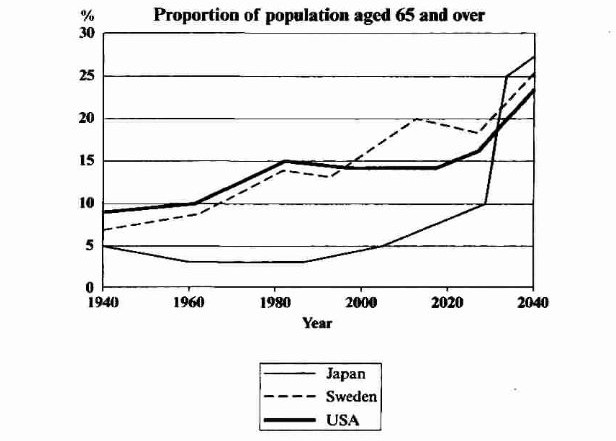
The graph below shows the proportion of the population aged 65 and over between 1940 and 2040 in three different countries.
Summarise the information by selecting and reporting the main features, and make comparisons where relevant.
Task 1 visual prompt for Cambridge IELTS Academic Book 5 Writing Test 1.