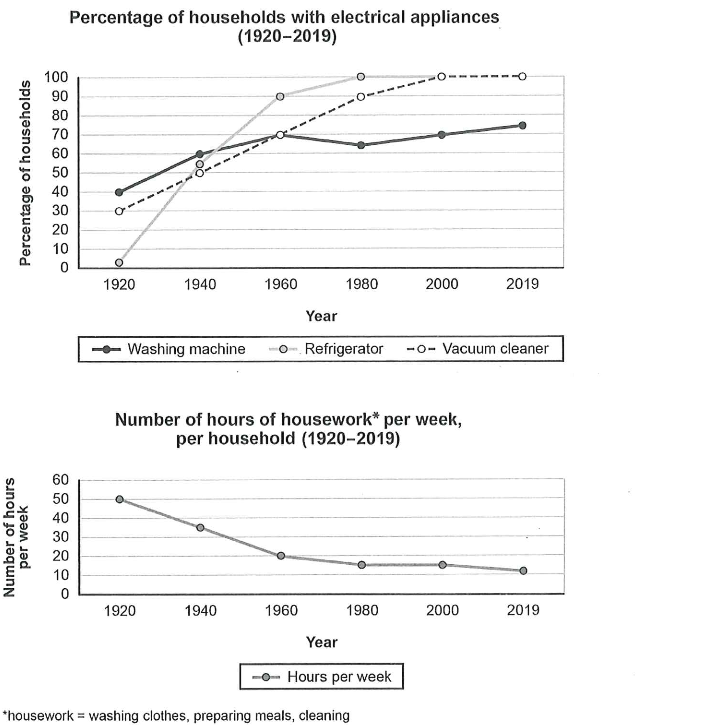
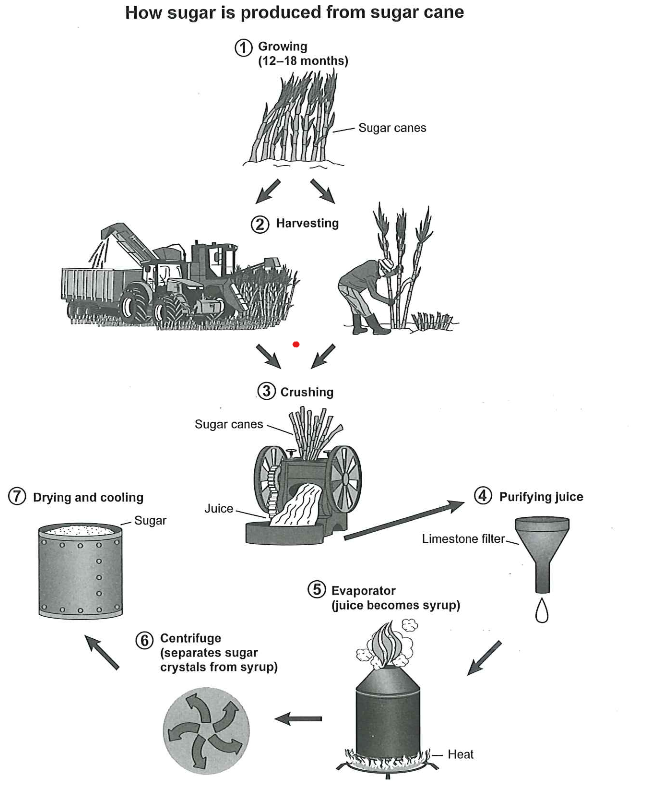
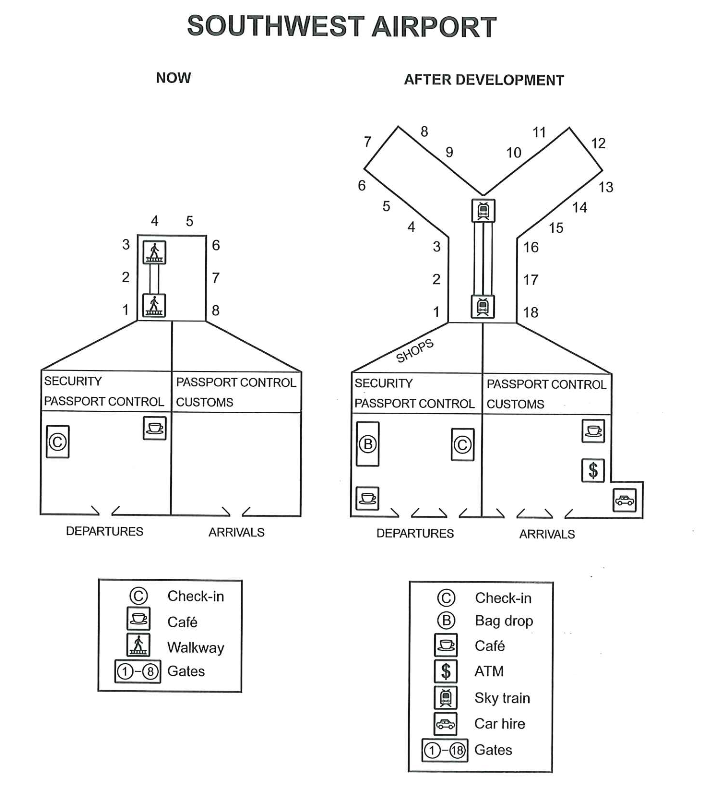
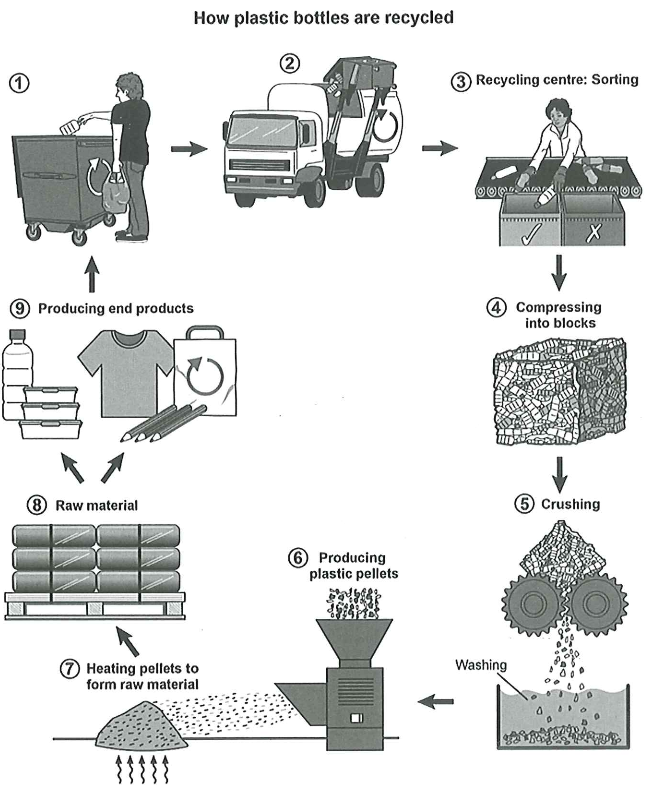
The charts below show the changes in ownership of electrical appliances and amount of time spent doing housework in households in one country between 1920 and 2019.
Summarise the information by selecting and reporting the main features, and make comparisons where relevant.
Hình đề Task 1 trong Cambridge IELTS 16 Academic Writing Test 1.
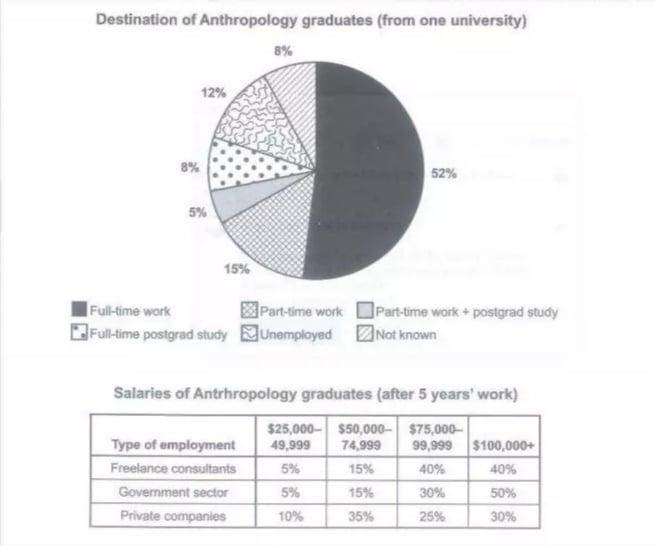
The chart below shows what Anthropology graduates from one university did after finishing their undergraduate degree course. The table shows the salaries of the anthropologists in work after five years.
Summarize the information by selecting and reporting the main features, and make comparisons where relevant.
Hình đề Task 1 trong Cambridge IELTS 15 Academic Writing Test 4.
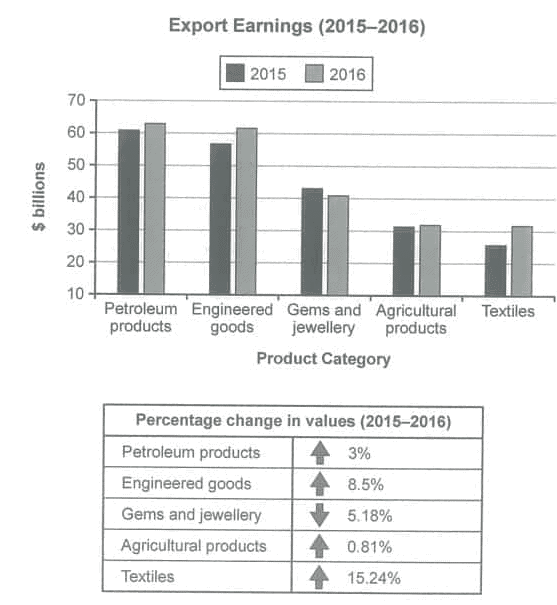
The chart below shows the value of one country’s exports in various categories during 2015 and 2016. The table shows the percentage change in each category of exports in 2016 compared with 2015.
Summarise the information by selecting and reporting the main features and make comparisons where relevant.
Hình đề Task 1 trong Cambridge IELTS 14 Academic Writing Test 2.