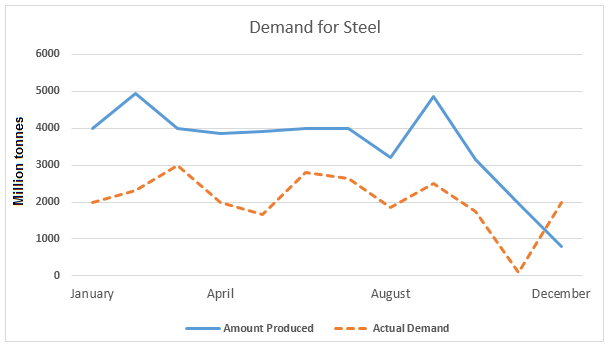
The line graphs below show the production and demand for steel in million tonnes and the number of workers employed in the steel industry in the UK in 2010.
The line graphs below show the production and demand for steel in million tonnes and the number of workers employed in the steel industry in the UK in 2010.
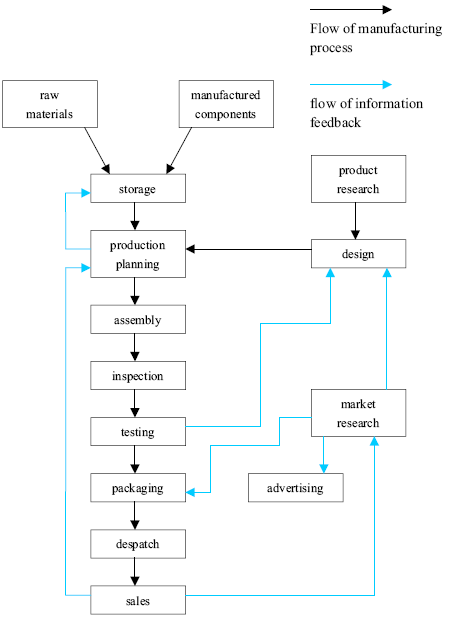
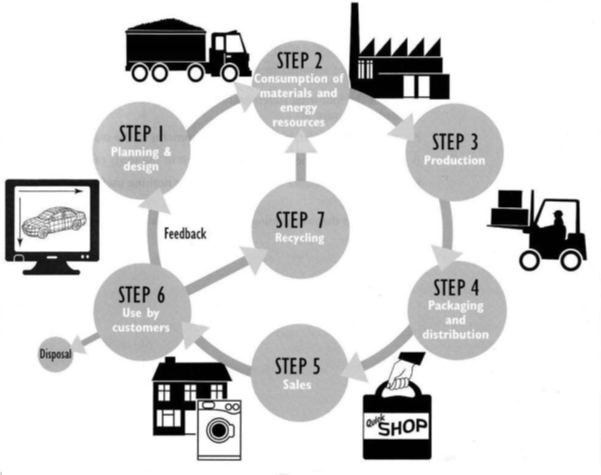
The diagram below shows the typical stages of consumer goods manufacturing, including the process by which information is fed back to earlier stages to enable adjustment.
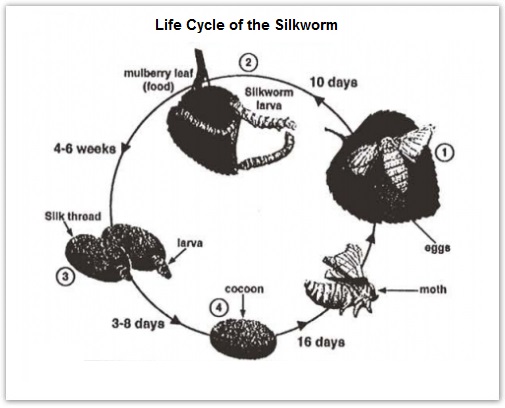
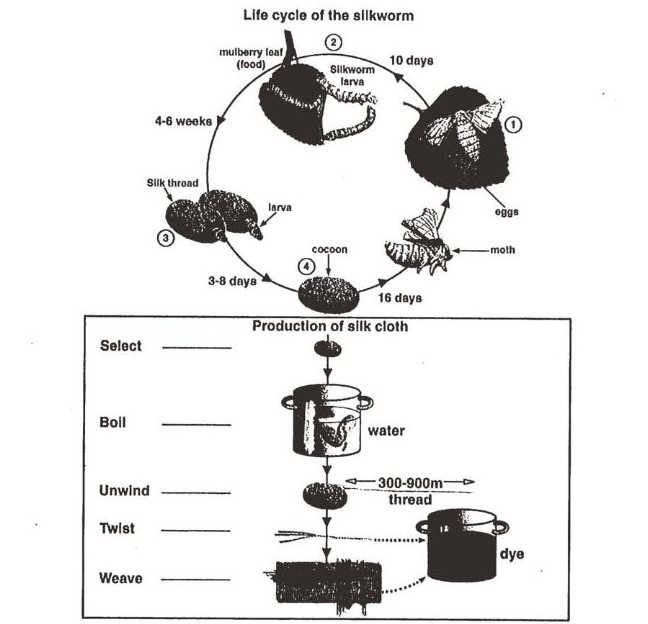
The diagrams below show the life cycle of the silkworm and the stages in the production of silk cloth.
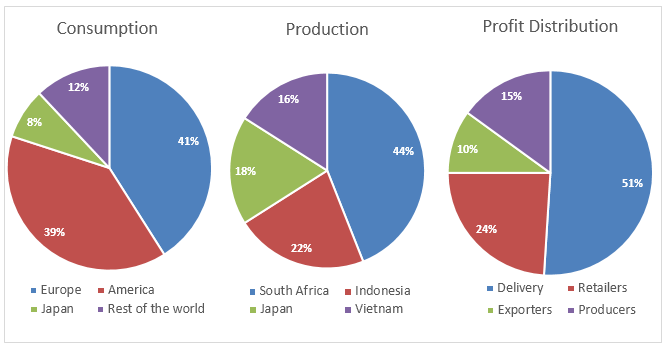
The pie charts below show the coffee production, coffee consumption and the profit distribution around the world.
The diagram below shows the environmental issues raised by a product over its lifecycle.
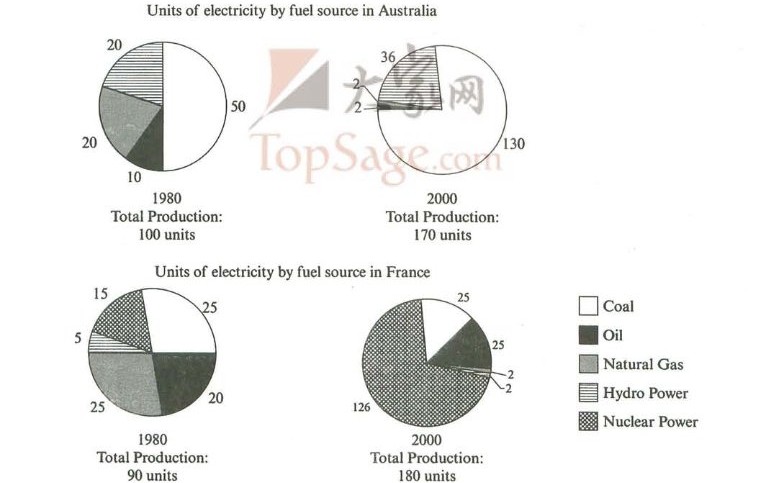
The pie charts below show units of electricity production by fuel source in Australia and France in 1980 and 2000. Summarise the information by selecting and reporting the main features, and make comparisons where relevant.
The diagrams below show the life cycle of the silkworm and the stages in the production of silk cloth. Summarise the information by selecting and reporting the main features, and make comparisons where relevant.
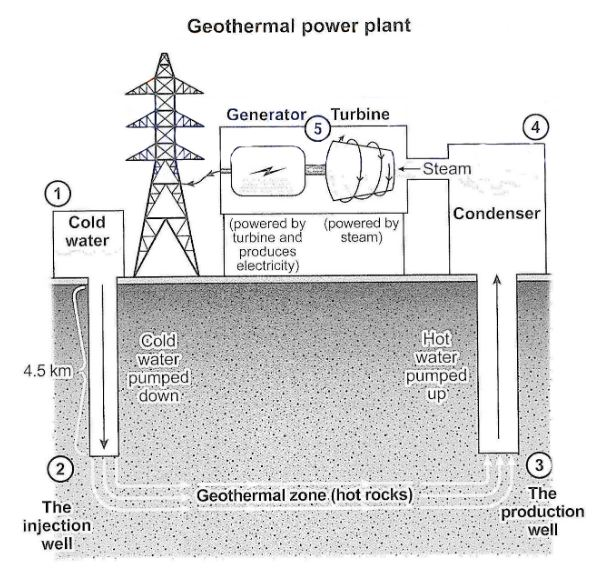
The diagram below shows how geothermal energy is used to produce electricity. Summarise the information by selecting and reporting the main features, and make comparisons where relevant.
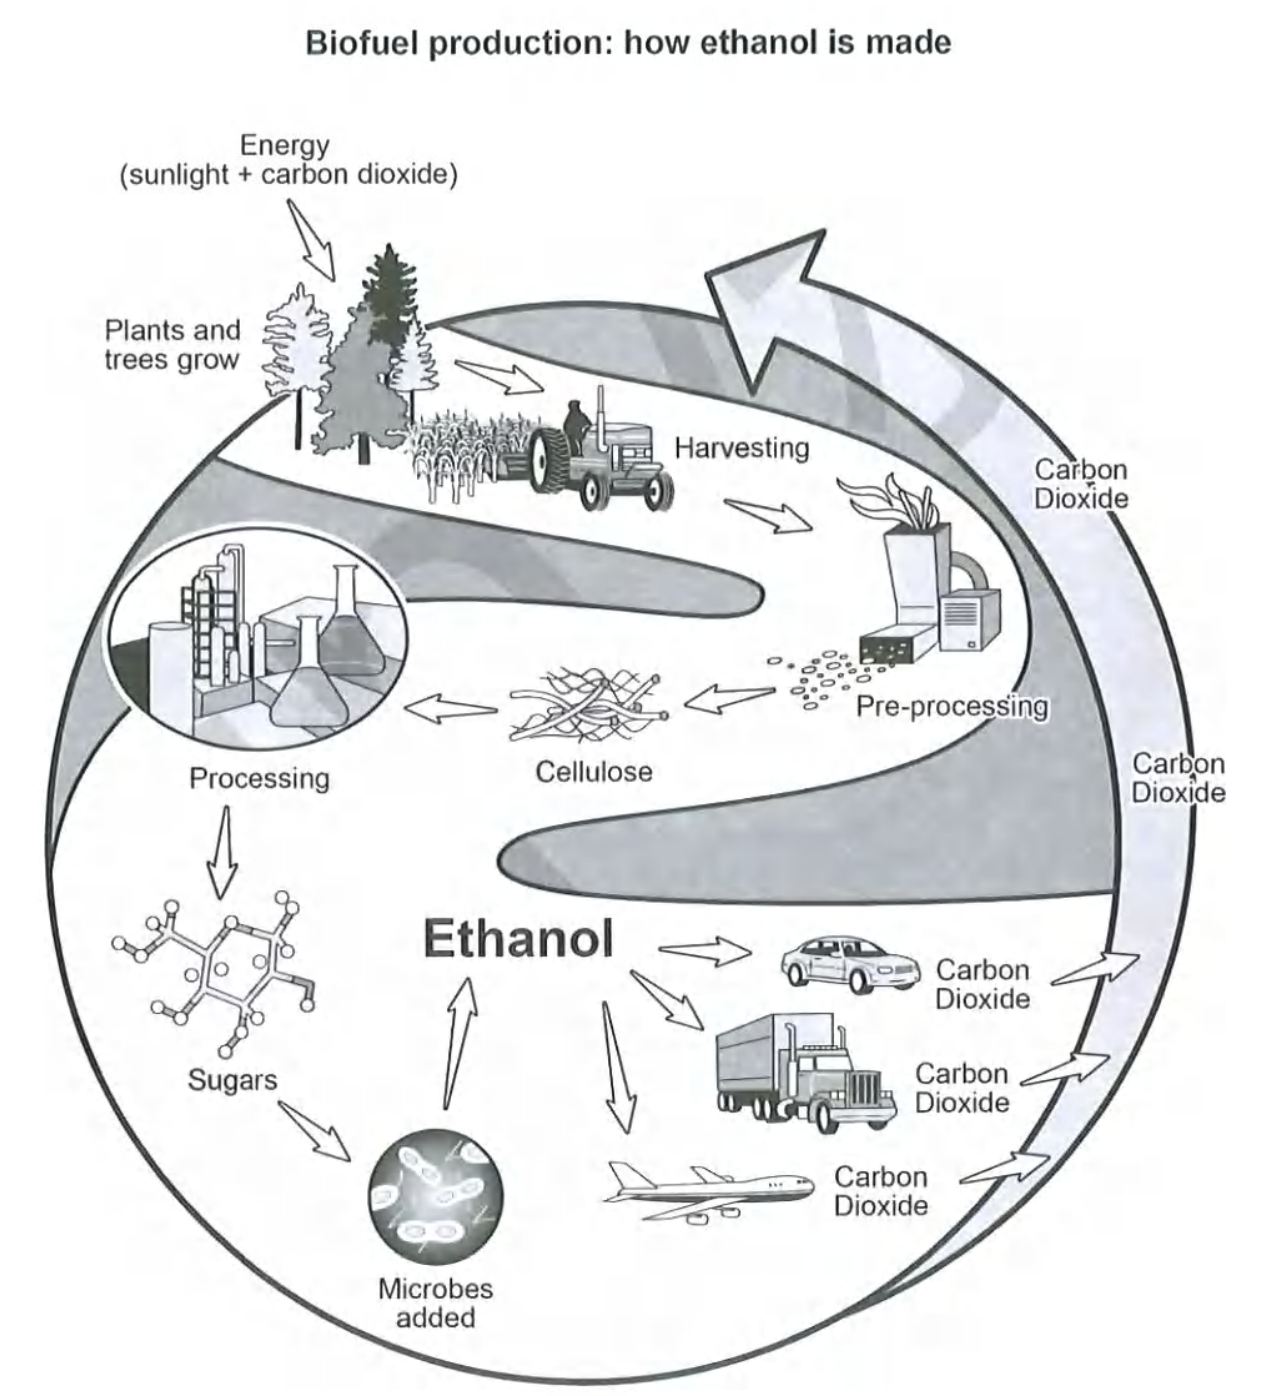
The diagram below shows how a biofuel called ethanol is produced. Summarise the information by selecting and reporting the main features, and make comparisons where relevant.
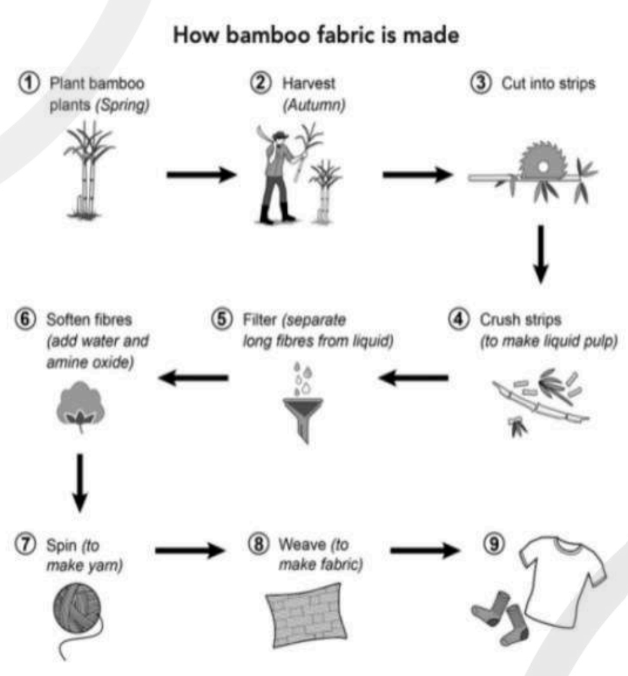
The diagram below shows how fabric is manufactured from bamboo. Summarise the information by selecting and reporting the main features, and make comparisons where relevant.
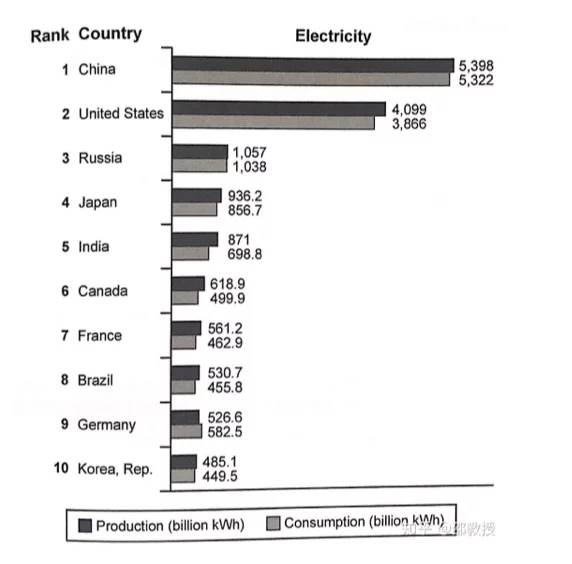
The bar chart below shows the top ten countries for the production and consumption of electricity in 2014. Summarise the information by selecting and reporting the main features, and make comparisons where relevant.
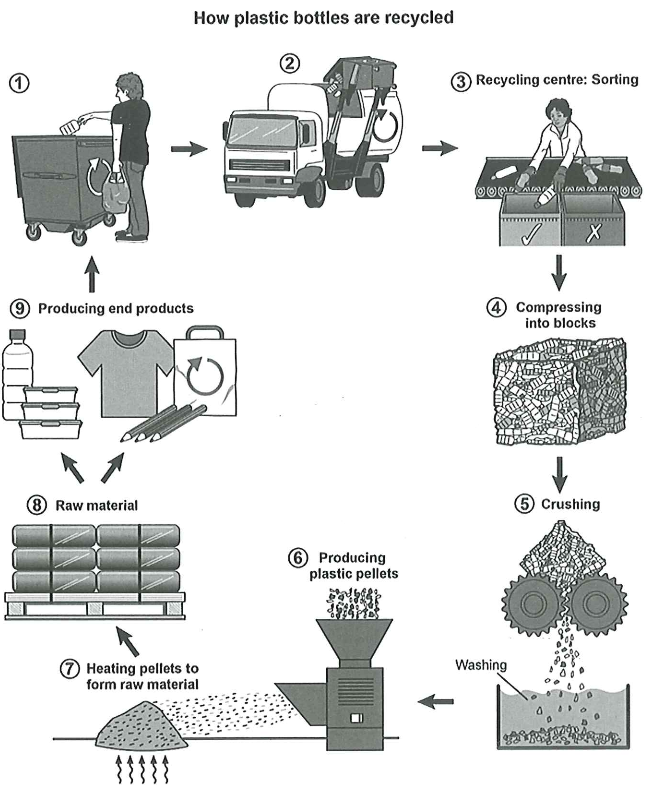
The diagram below shows the process for recycling plastic bottles. Summarize the information by selecting and reporting the main features, and make comparisons where relevant.