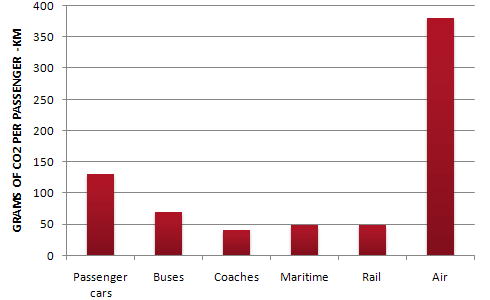
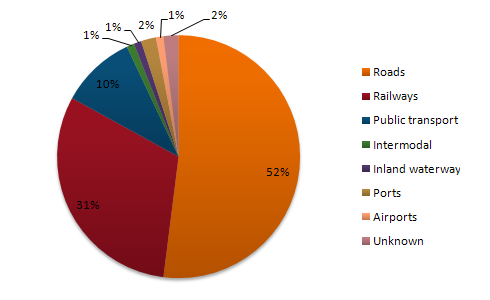
The graph below shows CO 2 emissions for different forms of transport in the European Union. The Pie Chart shows the percentage of European Union funds being spent on different forms of transport.
Sample Response
The graphs outline the amount of Carbon dioxide emission per passenger from different vehicles in the European Union and the EU expenditures on different modes of transportation. Overall, the highest amount of CO2 per person is emitted by the Air transports and the European Union spends the highest percentage of funds for the road transportation system. According to the bar graph, a single passenger of a personal car is responsible for around 130 gm of CO2 per kilometre while a passenger in a bus contributes to 65 gm CO2 eruption per kilometre. Coaches, maritime and rail passengers emit the lowest amount of CO2 which is about 50 grams per passenger. Finally, an aeroplane traveller contributes to 370 km of CO2 per kilometre which is the highest. Based on the pie chart, the European Union spent the highest amount (52%) on the road transportation system while spent only 1% to 2% on ports, waterway airport intermodal and other transport systems. They spent 31% on the rail system and 10% on the public transportation system. This indicates the European Union spent the majority of the budget on public transportations.
IELTS Writing Correction
- 1. Lowercase common noun Original: Carbon Suggested revision: carbon Why it matters: The chemical name is not a proper noun here, so it should not be capitalised.
- 2. Use plural emissions Original: emission Suggested revision: emissions Why it matters: The graph compares repeated quantities of emissions across transport modes.
- 3. Match chart categories Original: from different vehicles Suggested revision: from different forms of transport Why it matters: The visual compares transport modes, including maritime and rail travel, rather than only vehicles.
- 4. Use natural spending term Original: the EU expenditures Suggested revision: EU spending Why it matters: “Spending” is the more natural uncountable noun for the allocation shown.
- 5. Correct transport form Original: the Air transports Suggested revision: air transport Why it matters: “Transport” is uncountable in this category label and does not need an article or capital letter.
- 6. Correct allocation phrase Original: spends the highest percentage of funds for Suggested revision: allocates the highest percentage of funds to Why it matters: Funds are conventionally allocated to a category, not spent for it in this construction.
- 7. Clarify car passenger Original: a single passenger of a personal car Suggested revision: a passenger travelling by car Why it matters: This phrasing expresses the travel mode more naturally and directly.
- 8. Write unit clearly Original: gm Suggested revision: grams Why it matters: Writing the unit in full is clearer in a formal report.
- 9. Correct emissions verb Original: bus contributes to Suggested revision: bus produces Why it matters: A passenger or journey produces an amount of emissions rather than contributing to that numerical amount.
- 10. Add unit preposition Original: 65 gm Suggested revision: 65 grams of Why it matters: The quantity requires “of” before the substance being measured.
- 11. Use emissions term Original: eruption Suggested revision: emissions Why it matters: “Eruption” does not describe carbon dioxide released by transport.
- 12. Show contrast Original: Finally Suggested revision: By contrast Why it matters: The air figure contrasts sharply with the preceding low-emission modes rather than marking a final sequence stage.
Suggested Rewrites
- Carbon carbon
- emission emissions
- from different vehicles from different forms of transport
- the EU expenditures EU spending
- the Air transports air transport
- spends the highest percentage of funds for allocates the highest percentage of funds to
Why this response received Band 6.5
The response clearly covers both visuals, gives an effective overview, and reports most of the major figures. Its main weakness is precision: the air figure is assigned the wrong unit, the final claim mischaracterises road spending as public transport, and several awkward grammatical or lexical choices reduce control; prioritise checking units and categories against the charts before refining the language.
IELTS Writing Criteria Scores
Task Achievement
A clear overview identifies the two dominant features and most figures are accurate, although the air-emissions unit and final interpretation of road spending are inaccurate.
Check every unit and category against the visuals, then end with an accurate comparison rather than an unsupported interpretation.
Coherence and Cohesion
Information progresses logically from the overview through emissions to spending, but it is presented as one block and some linking is mechanical.
Separate the overview and the two datasets into purposeful paragraphs, using transitions only where the comparison requires them.
Lexical Resource
The response uses a sufficient range of transport and comparison vocabulary, but inaccurate combinations such as "CO2 eruption" and "Air transports" reduce precision.
Use established chart language such as "emits," "emissions per passenger-kilometre," and "air travel" consistently.
Grammatical Range and Accuracy
A mix of simple and complex sentences communicates the data clearly, though article, agreement, clause, and list-structure errors recur.
Proofread each comparative sentence for a complete subject and verb, correct articles, and parallel category lists.
Write this task while it is fresh
Try the same task now. It helps you remember the feedback and write better next time.
IELTS Academic Writing Task 1
The graph below shows CO 2 emissions for different forms of transport in the European Union. The Pie Chart shows the percentage of European Union funds being spent on different forms of transport.
Your response
Write the task yourself, then compare your choices with the annotated response.