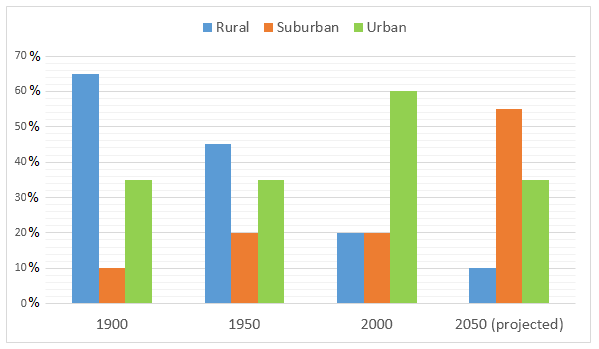
The graph below shows the figures for population distribution in the Northwest Region for 1900-2050. Population Distribution in the Northwest Region
Sample Response
The bar graph shows the percentages of rural, suburban and urban populations in Northwest region in four different years including the projection of population distribution in 2050. Overall, the percentage of the village-living population rapidly decreased over the time and a great percentage of people will live in city areas in Northwest region in the future. According to the given column graph, more than six out of ten persons in Northwest region in 1900 lived in rural areas while one out of ten lived in suburban areas. The percentage of urban area’s population was around 35 in this same year. After 5 decades, the population circulation in this region greatly changed and more than half of the population started living in urban and suburban areas. In the year 2000, six out of ten people in this region lived in urban areas while the remaining four were in urban and rural areas. According to the projection in 2050, more than half of the North-western population will live in suburban areas while only 10% will remain in the village area. The remaining 35% of its population would settle in urban areas.
IELTS Writing Correction
- 1. Add definite article Original: populations in Northwest region Suggested revision: populations in the Northwest Region Why it matters: The named region requires the definite article and consistent capitalisation.
- 2. Separate added detail Original: four different years including Suggested revision: four years, including Why it matters: A comma should separate the added phrase about the projected year.
- 3. Use concise projection Original: projection of population distribution Suggested revision: projected population distribution Why it matters: The adjective projected expresses the same meaning more directly.
- 4. Use natural people noun Original: persons Suggested revision: people Why it matters: People is the more natural term in a demographic description.
- 5. Use category label Original: urban area’s population Suggested revision: urban population Why it matters: Urban population is the direct category shown by the graph.
- 6. Include percent unit Original: around 35 in this Suggested revision: around 35% in this Why it matters: The vertical scale reports percentages, so the figure needs a percent sign.
- 7. Link next year Original: After 5 decades Suggested revision: Fifty years later Why it matters: The revised transition links 1900 directly to 1950.
- 8. Use distribution term Original: circulation Suggested revision: distribution Why it matters: The graph shows how the population was distributed, not circulated.
- 9. Use academic adverb Original: greatly changed Suggested revision: changed substantially Why it matters: Substantially is more precise for describing a marked statistical change.
- 10. Describe snapshot data Original: started living Suggested revision: lived Why it matters: The bar for 1950 shows a distribution at that time rather than the start of a behaviour.
- 11. Use concise date Original: In the year 2000 Suggested revision: In 2000 Why it matters: The shorter time expression is standard in chart descriptions.
- 12. State full percentage Original: the remaining four Suggested revision: the remaining 40% Why it matters: The phrase refers to four out of ten people and should report the percentage explicitly.
Suggested Rewrites
- populations in Northwest region populations in the Northwest Region
- four different years including four years, including
- projection of population distribution projected population distribution
- persons people
- urban area’s population urban population
- around 35 in this around 35% in this
Why this response received Band 6.5
The response covers all four years and reports most percentages accurately, with the rise of suburban living and fall in rural living becoming clear through the details. Its main limitation is an imprecise overview and one confusing 2000 comparison that labels both remaining groups as urban and rural. Prioritise a sharper summary of the three contrasting trajectories, then use exact category names consistently throughout.
IELTS Writing Criteria Scores
Task Achievement
Most key values and changes are included accurately, but the overview does not clearly distinguish the suburban rise from the urban peak and later decline.
State that rural residence fell continuously, suburban residence became dominant by 2050, and urban residence peaked in 2000 before returning to 35%.
Coherence and Cohesion
The response follows the years in a logical order, though some comparisons are compressed and the reference to the remaining groups in 2000 is unclear.
Use separate detail paragraphs for 1900–1950 and 2000–2050, with one explicit sentence comparing all three groups in each period.
Lexical Resource
There is sufficient vocabulary for population change and projections, but expressions such as "village-living population" and "population circulation" are unnatural.
Use precise combinations such as "rural population," "population distribution," and "was projected to live" consistently.
Grammatical Range and Accuracy
A range of sentence structures is generally controlled, although article, preposition, and reference errors remain noticeable.
Edit phrases such as "in the Northwest Region," "over time," and "the other four out of ten lived in suburban and rural areas."
Write this task while it is fresh
Try the same task now. It helps you remember the feedback and write better next time.
IELTS Academic Writing Task 1
The graph below shows the figures for population distribution in the Northwest Region for 1900-2050. Population Distribution in the Northwest Region
Your response
Write the task yourself, then compare your choices with the annotated response.