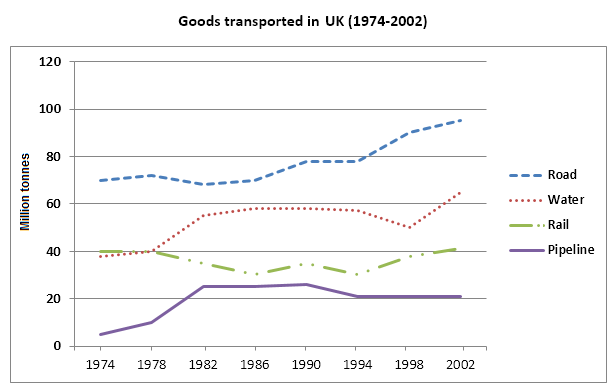
The graph below shows the quantities of goods transported in the UK between 1974 and 2002 by four different modes of transport.
Sample Response
The graph illustrates the differences in transport from 1974 to 2002 in UK transport. It can be noticed that the graph for pipeline remained steady from 1994 to 2002. However, other means of transportation on roads, water and railways went up slowly in the same year.
Goods transported using pipeline in the UK from 1974 and 2002 stayed constant at 20 million tonnes from 1994 up to 2002, which started at about one million tonnes in 1994. Unlike, Road and Water goods transported in those rose to 40 million tonnes. At the beginning of 1974, Pipeline increased in 1982 to almost 20 million tonnes and still maintained the same level from 1982 to 1990 and between 1990 to 1994 decreased slowly.
Three goods transport in the UK (1974-2002) were Road, Water and Rail showed a rise slowly in 2002. Goods transported in Road got higher than Water and Rail. Although, the waterway goods transportation stayed constant at approximately 60 million tonnes in 1982. Roadway transported goods reduced slowly to about 70 million tonnes. The pipeline had different statistics which increased slowly but most still levelled out at null to twenty million tonnes than others fluctuated from 1975 until 2002.
IELTS Writing Correction
- 1. Identify measured quantity Original: differences in transport Suggested revision: quantities of goods transported Why it matters: The graph compares freight quantities rather than unspecified differences in transport.
- 2. Add country article Original: in UK transport Suggested revision: in the UK Why it matters: The country name requires the definite article, and transport is redundant here.
- 3. Name transport mode Original: the graph for pipeline Suggested revision: pipeline transport Why it matters: The revised phrase refers directly and naturally to the mode being described.
- 4. Use parallel mode names Original: means of transportation on roads, water and railways Suggested revision: road, water and rail transport Why it matters: Parallel noun forms clearly identify the three transport modes.
- 5. Avoid inaccurate trend Original: went up slowly Suggested revision: showed different trends Why it matters: Road and water rose overall, whereas rail fluctuated and ended close to its starting level.
- 6. Correct time reference Original: in the same year Suggested revision: over the period Why it matters: The statement summarizes changes across 1974-2002 rather than within a single year.
- 7. Correct noun phrase Original: Three goods transport Suggested revision: The three other transport modes Why it matters: The graph presents modes of transporting goods, not three types of goods transport.
- 8. Repair clause structure Original: were Road, Water and Rail showed Suggested revision: —road, water and rail—showed Why it matters: The revised parenthetical list leaves one grammatical main verb in the clause.
- 9. Use adjective form Original: a rise slowly Suggested revision: an overall rise Why it matters: A noun such as rise requires an adjective rather than the adverb slowly.
- 10. Describe full period Original: in 2002 Suggested revision: over the period Why it matters: The trends developed across the whole time span and were not confined to 2002.
- 11. Correct transport preposition Original: in Road Suggested revision: by road Why it matters: Freight is described as being transported by a particular mode.
- 12. Complete the comparison Original: got higher than Suggested revision: was greater than that transported by Why it matters: The replacement creates a grammatical comparison between freight quantities.
Suggested Rewrites
- differences in transport quantities of goods transported
- in UK transport in the UK
- the graph for pipeline pipeline transport
- means of transportation on roads, water and railways road, water and rail transport
- went up slowly showed different trends
- in the same year over the period
Why this response received Band 5.0
The response shows some awareness of the pipeline's later stability and attempts to compare all four transport modes. However, major figures and trends are inaccurate or unclear, including the pipeline's starting point and the final levels for road and water, while frequent language errors obscure several statements. The priority is to identify the dominant overall patterns first, then report a small number of verified values in chronological, mode-based groups.
IELTS Writing Criteria Scores
Task Achievement
The response mentions all four modes and the pipeline plateau, but major trends, dates, and quantities are omitted, confused, or inaccurately reported.
State that road remained highest, water rose overall, rail fluctuated near 30-40 million tonnes, and pipeline climbed then levelled at 20 million tonnes.
Coherence and Cohesion
Paragraphing is present, but repeated pipeline details, weak grouping, and misused links prevent a clear progression through the data.
Use one overview paragraph and two detail paragraphs grouping road with water and rail with pipeline, each moving consistently from 1974 to 2002.
Lexical Resource
The vocabulary is sufficient to name transport modes and basic changes, but repetition and frequent inaccurate collocations limit precision.
Use standard expressions such as 'goods transported by road', 'rose gradually', 'fluctuated', and 'remained stable at 20 million tonnes'.
Grammatical Range and Accuracy
Some complex structures are attempted, but frequent errors in clause formation, prepositions, agreement, and sentence boundaries often strain clarity.
Build shorter complete sentences with one clear subject and verb, then check time expressions such as 'between 1974 and 2002' and 'from 1994 to 2002'.
Write this task while it is fresh
Try the same task now. It helps you remember the feedback and write better next time.
IELTS Academic Writing Task 1
The graph below shows the quantities of goods transported in the UK between 1974 and 2002 by four different modes of transport.
Your response
Write the task yourself, then compare your choices with the annotated response.