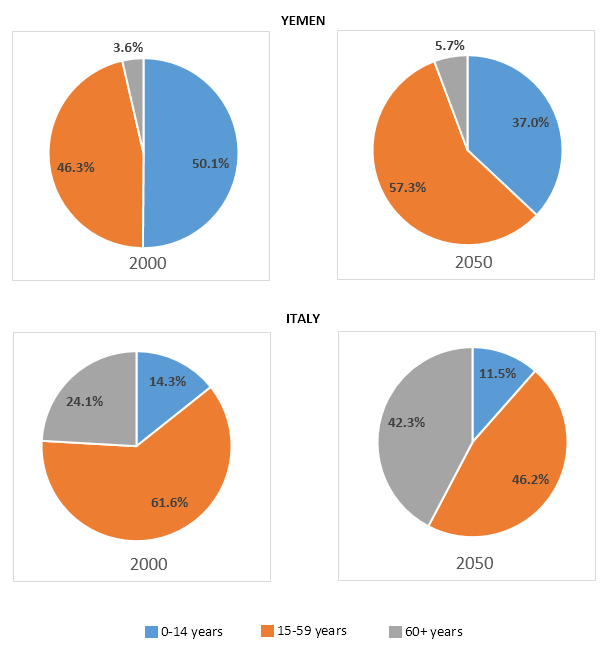
The charts below give information on the ages of the populations of Yemen and Italy in 2000 and projections for 2050.
Sample Response
The pie charts show data on the ages of the population in Yemen and Italy in the year 2000, and also forecast these portions of the population for the year 2050.
In general, the elderly population in Italy will be much higher in proportion than that of Yemen.
According to the given data, more than half of the population of Yemen was below 14 years old in the year 2000. In this same year, their population from 15 to 59 years old was just over 46% and only about 3% of their population was over 60 years old. This year there was one-fourth population in Italy was over 60 years old and more than 60% of their population was from 15 to 59 years old. The percentage of aged people in Italy was much higher than in Yemen in 2000. Finally, the percentage of the population up to 14 years in Italy was less than 15% this year.
The pie charts also give the projection of the percentage of population based on age group for the year 2050 and according to this projection, the percentage of younger people in Yemen would decrease while the number of ag d people over 60 years would increase only by 2%. On the contrary, the aged people in Italy in 2050 would be more than 40% while they would have fewer young people in comparison.
IELTS Writing Correction
- 1. Use precise term Original: ages of the population in Yemen and Italy Suggested revision: age distributions of the populations of Yemen and Italy Why it matters: Age distribution is the standard term for proportions divided into age groups.
- 2. Correct word choice Original: forecast these portions Suggested revision: project these proportions Why it matters: Proportions describes percentage shares, while portions is imprecise here.
- 3. Use possessive form Original: the population of Yemen Suggested revision: Yemen's population Why it matters: The possessive form is more concise and natural in this sentence.
- 4. Match age category Original: below 14 years old Suggested revision: aged 14 or under Why it matters: The chart's category is 0–14 years, which includes people aged 14.
- 5. Describe people correctly Original: their population from 15 to 59 years old Suggested revision: people aged 15 to 59 Why it matters: People, rather than a population, are described as being within an age range.
- 6. Report precise figure Original: only about 3% Suggested revision: 3.6% Why it matters: The chart provides the exact share for Yemen's oldest group in 2000.
- 7. Use neutral age term Original: The percentage of aged people Suggested revision: The proportion of people aged 60 or over Why it matters: This wording precisely matches the chart category and avoids an unnatural label.
- 8. Fix age phrasing Original: the population up to 14 years Suggested revision: the population aged 0–14 Why it matters: A population group should be described with aged followed by its age range.
- 9. Specify value and year Original: less than 15% this year Suggested revision: 14.3% in 2000 Why it matters: The exact figure and explicit year make the comparison easier to verify.
- 10. Simplify noun phrase Original: the projection of the percentage of population based on age group Suggested revision: projections of population shares by age group Why it matters: The revision expresses the chart content concisely and idiomatically.
- 11. Reduce repetition Original: for the year 2050 and according to this projection Suggested revision: for 2050; according to these projections Why it matters: The semicolon separates two closely related clauses and avoids repeating projection in the singular.
- 12. Name exact group Original: the percentage of younger people in Yemen Suggested revision: the proportion of people aged 0–14 in Yemen Why it matters: The chart defines a specific age group rather than the vague category younger people.
Suggested Rewrites
- ages of the population in Yemen and Italy age distributions of the populations of Yemen and Italy
- forecast these portions project these proportions
- the population of Yemen Yemen's population
- below 14 years old aged 14 or under
- their population from 15 to 59 years old people aged 15 to 59
- only about 3% 3.6%
Why this response received Band 7.0
The response is logically organised and gives an accurate comparison of the two populations, with particularly useful figures for 2000 and a clear contrast in the projected elderly shares. The projection section is less complete because it omits the substantial middle-age changes and gives few exact 2050 figures. Prioritise a fuller, quantified comparison of every age group in 2050 while correcting awkward sentence structures.
IELTS Writing Criteria Scores
Task Achievement
The main contrast and most 2000 data are accurately covered, but the 2050 description omits important figures and changes in the 15-59 group.
Quantify all three projected age groups and highlight that the 15-59 share rises in Yemen but falls markedly in Italy.
Coherence and Cohesion
Clear paragraphing and a sensible movement from the overview through 2000 data to projections make the report easy to follow.
Reduce repeated time references and use more precise links when shifting between countries and age groups.
Lexical Resource
Vocabulary for describing proportions and projections is sufficiently varied, though choices such as 'aged people' and 'portions of the population' are sometimes awkward.
Prefer precise terms such as 'the over-60 population,' 'share,' and 'percentage-point increase' when reporting age data.
Grammatical Range and Accuracy
The response uses varied sentence forms with generally clear meaning, but several agreement and clause-structure errors remain noticeable.
Revise malformed constructions such as the sentence about one-fourth of Italy's population and check noun phrases for missing articles.
Write this task while it is fresh
Try the same task now. It helps you remember the feedback and write better next time.
IELTS Academic Writing Task 1
The charts below give information on the ages of the populations of Yemen and Italy in 2000 and projections for 2050.
Your response
Write the task yourself, then compare your choices with the annotated response.