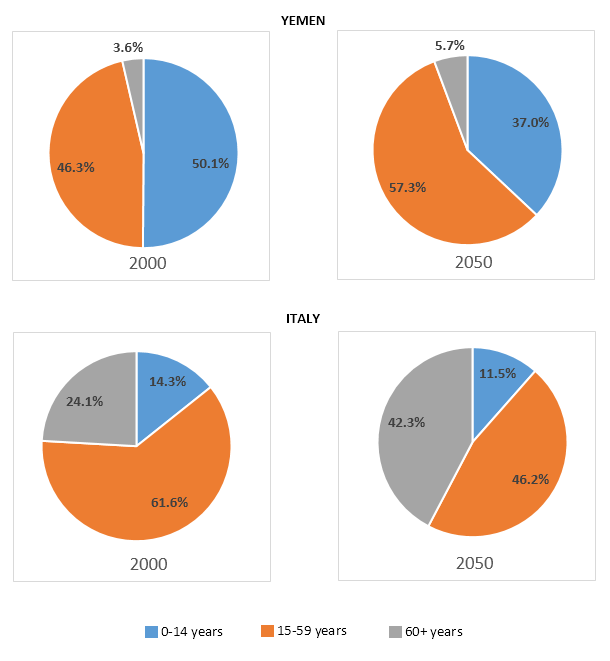
The charts below give information on the ages of the populations of Yemen and Italy in 2000 and projections for 2050.
Sample Response
The pie charts illustrate the proportion of populations in Yemen and Italy according to 3 different age groups in 2000, with the future forecast for 2050. It can be seen that in both countries the general trend is for a predicted increase in the population of people aged 60+ and a decrease in those aged 0-14 by 2050. Looking at Yemen in 2000, around half of the population was aged 0-14 but this is predicted to decline by 13% by 2050. On the contrary, the 60+ age group will increase by 2% by 2050 to a figure of 5.7%. Likewise, those aged 15-59 years is forecast to increase from 46.3% to 57.3%. Turning now to Italy in 2000, there is a similar rise predicted for 60 plus age group; from around 24% in 2000 to 42.3% by 2050. The -0-14 age-groups, like in Yemen, is predicted to decrease by around 3% by 2050 to a figure of 11.5%. Those aged 15-59 years is forecast to plummet by about 15% to a figure of 46.2%. To conclude, in Yemen and Italy we would expect to observe an increase in elderly in 60+ by 2050. By contrast, it is predicted that the 0-14 age group would plummet by 2050.
IELTS Writing Correction
- 1. Use plural proportions Original: proportion of populations Suggested revision: proportions of the populations Why it matters: The charts show multiple proportions across two national populations.
- 2. Use formal number style Original: 3 different age groups Suggested revision: three age groups Why it matters: Spelling out this small number is more natural in a formal report.
- 3. Use concise projection wording Original: with the future forecast for 2050 Suggested revision: with projections for 2050 Why it matters: The replacement is more concise and avoids the redundant phrase future forecast.
- 4. Refer to a proportion Original: population Suggested revision: proportion Why it matters: The charts report shares of each population rather than the number of people.
- 5. State percentage-point change Original: decline by 13% Suggested revision: fall by 13.1 percentage points Why it matters: Yemen's 0–14 share changes from 50.1% to 37.0%, a 13.1-point fall rather than a 13% fall.
- 6. Use contrast linker Original: On the contrary Suggested revision: By contrast Why it matters: By contrast links two different trends, whereas on the contrary normally rejects a preceding claim.
- 7. Correct the change Original: increase by 2% Suggested revision: increase by 2.1 percentage points Why it matters: The 60+ share in Yemen rises from 3.6% to 5.7%, a 2.1-point increase.
- 8. Fix subject agreement Original: Likewise, those aged 15-59 years is forecast Suggested revision: Likewise, those aged 15–59 are forecast Why it matters: The plural subject those requires are rather than is.
- 9. Add the article Original: for 60 plus age group Suggested revision: for the 60+ age group Why it matters: This specific age group needs the definite article.
- 10. Replace the semicolon Original: ; Suggested revision: , Why it matters: The following from-phrase is not an independent clause, so a semicolon is incorrect.
- 11. Correct the age label Original: The -0-14 age-groups Suggested revision: The 0–14 age group Why it matters: The initial hyphen is erroneous and age group should be singular here.
- 12. Use comparison form Original: like Suggested revision: as Why it matters: As in is the standard form for comparing the same pattern across countries.
Suggested Rewrites
- proportion of populations proportions of the populations
- 3 different age groups three age groups
- with the future forecast for 2050 with projections for 2050
- population proportion
- decline by 13% fall by 13.1 percentage points
- On the contrary By contrast
Why this response received Band 7.0
The response accurately reports the principal changes in both countries, supports them with nearly all the relevant figures, and provides a clear overview of the shared ageing trend. Its main limitation is presentation: the single-block structure, some awkward linking, and recurring agreement errors reduce fluency. The highest priority is to organise the overview and country details into distinct paragraphs while checking subject-verb agreement.
IELTS Writing Criteria Scores
Task Achievement
The response gives a clear overview and accurately covers the main changes and relevant figures for all age groups in both countries.
Make the contrast between the countries' different working-age trends explicit and describe changes as percentage-point shifts where appropriate.
Coherence and Cohesion
Information progresses logically from the overview to Yemen and then Italy, but the single-block presentation and a few imprecise links weaken cohesion.
Separate the introduction, overview, and country details into purposeful paragraphs and use linking phrases only where the relationship is exact.
Lexical Resource
A good range of task-appropriate vocabulary conveys trends clearly, although a few choices such as repeated use of "plummet" are imprecise or overstated.
Choose trend verbs that match the scale of each change and replace awkward phrases with concise demographic language.
Grammatical Range and Accuracy
The response uses varied sentence structures successfully, but recurring subject-verb agreement and article errors remain noticeable.
Check agreement in structures such as "those aged 15-59 are forecast" and add articles consistently before named age groups.
Write this task while it is fresh
Try the same task now. It helps you remember the feedback and write better next time.
IELTS Academic Writing Task 1
The charts below give information on the ages of the populations of Yemen and Italy in 2000 and projections for 2050.
Your response
Write the task yourself, then compare your choices with the annotated response.