The charts below show the average percentages in typical meals of three types of nutrients, all of which may be unhealthy if eaten too much. Average percentages of sodium, saturated fats and added sugars in typical meals consumed in the USA
Same question Compare 2 different answers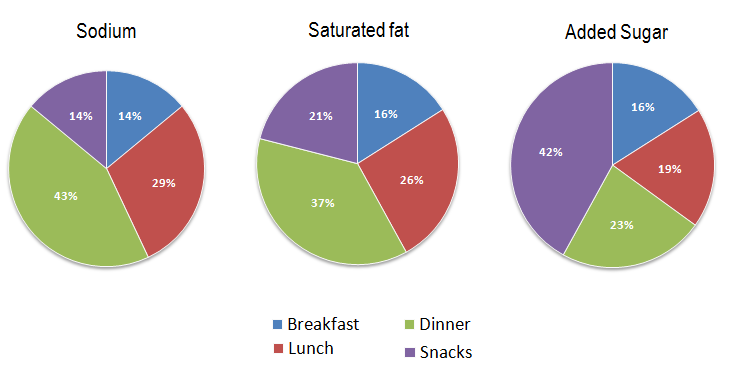
Sample Response
The diagram illustrates the proportion of three types of nutrients in typical meals, which can be unhealthy if consumed too much. 'Sodium', 'saturated fats' and 'added sugar' are these three food nutrients and the data is taken from the breakfast, lunch, dinner and snacks Americans eat. Generally speaking, Americans eat less sodium, saturated fats and sugar during their breakfast but they consume a large proportion of them while they eat their lunch and dinner. The snacks also contain these nutrients in plenty. The first chart shows the average percentage of sodium intake by Americans. Dinner contains the highest ratio of sodium (43%) while 29% of it is eaten while having lunch. Breakfast and snacks include an equal proportion of sodium, which is 14% each. The second chart outlines the percentages of saturated fats in meals. By eating dinner, average Americans consume 37% of saturated fats, which is the highest among the meal types. Lunch contributes to a consumption of 26% saturated fats, followed by snacks with 21% and breakfast with 16%. The last pie chart illustrates the proportion of added sugar in meals. Snacks contain the highest proportion of it, 42%. A typical dinner includes 23% sugar while lunch and breakfast contain 19% and 16% respectively. It is worth noticing that, these three nutrients are less consumed through breakfasts by Americans.
IELTS Writing Correction
- 1. Use precise chart term Original: diagram Suggested revision: charts Why it matters: The visual consists of three pie charts rather than a single diagram.
- 2. Remove redundancy Original: food nutrients Suggested revision: nutrients Why it matters: The word “nutrients” already makes the reference to food clear.
- 3. Correct meal preposition Original: during their breakfast Suggested revision: at breakfast Why it matters: Use “at” when referring to consumption associated with a meal.
- 4. Use formal quantity phrase Original: in plenty Suggested revision: in high proportions Why it matters: This phrase describes the charted percentages more precisely and formally.
- 5. Use chart terminology Original: ratio Suggested revision: proportion Why it matters: “Proportion” accurately describes the percentage shown in the chart.
- 6. Correct opening phrase Original: By eating dinner Suggested revision: At dinner Why it matters: The original participial phrase is unnatural for identifying a meal category.
- 7. Place adverb correctly Original: average Americans Suggested revision: Americans on average Why it matters: This word order correctly expresses an average across Americans.
- 8. Use concise proportion verb Original: contributes to a consumption of Suggested revision: accounts for Why it matters: “Accounts for” is the natural verb for reporting a share of a total.
- 9. Sentence rewrite Original: 'Sodium', 'saturated fats' and 'added sugar' are these three food nutrients and the data is taken from the breakfast, lunch, dinner and snacks Americans eat. Suggested revision: The three nutrients are sodium, saturated fat and added sugar, and the charts divide their consumption among breakfast, lunch, dinner and snacks. Why it matters: The rewrite removes the awkward inversion and states clearly how the meal categories relate to the data.
- 10. Sharpen the overview Suggested revision: State that breakfast has the lowest share of all three nutrients, while dinner is highest for sodium and saturated fat and snacks are highest for added sugar. Why it matters: The current overview does not clearly distinguish the contrasting peak meal categories shown across the three charts.
Suggested Rewrites
- diagram charts
- food nutrients nutrients
- during their breakfast at breakfast
- in plenty in high proportions
- ratio proportion
- By eating dinner At dinner
Why this response received Band 7.5
The response is strongest in its complete and largely accurate reporting of all twelve percentages, with clear identification of the leading meal for each nutrient. Its overview is somewhat imprecise about snacks and the presentation is compressed into one paragraph, while several collocations sound unnatural. Prioritise a sharper overview that contrasts dinner’s dominance in sodium and saturated fat with snacks’ dominance in added sugar, then separate the overview from the detailed comparisons.
IELTS Writing Criteria Scores
Task Achievement
The report accurately covers all values and identifies the main high and low points, although the overview’s broad claim about snacks is imprecise.
Make the overview more selective by contrasting dinner’s lead for sodium and saturated fat with snacks’ lead for added sugar.
Coherence and Cohesion
Information progresses logically through the three charts with clear referencing, but the single-block presentation and repeated closing observation weaken organisation slightly.
Use a separate overview paragraph and group the detailed comparisons into clearly defined paragraphs without repeating the same low-breakfast point.
Lexical Resource
A sufficiently wide range of vocabulary describes proportions and rankings clearly, despite several unnatural combinations such as nutrients being eaten during a meal.
Use more natural data-reporting collocations such as accounts for, is consumed at, and represents the largest share.
Grammatical Range and Accuracy
The response uses varied complex structures with generally good control, while a few article, preposition, agreement, and punctuation slips remain.
Proofread complex sentences for small errors, especially misplaced commas and awkward prepositional phrasing.
Write this task while it is fresh
Try the same task now. It helps you remember the feedback and write better next time.
IELTS Academic Writing Task 1
The charts below show the average percentages in typical meals of three types of nutrients, all of which may be unhealthy if eaten too much. Average percentages of sodium, saturated fats and added sugars in typical meals consumed in the USA
Your response
Write the task yourself, then compare your choices with the annotated response.