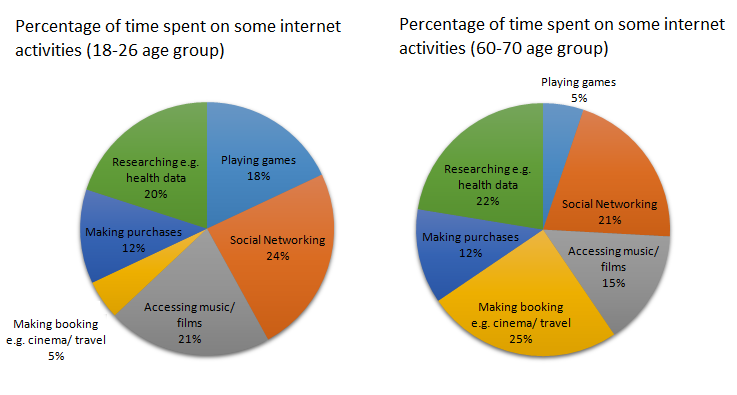
The charts below show the percentage of time younger and older people spend on various Internet activities in their free time (excluding email).
Sample Response
The pie charts illustrate the proportion of time people allocate on different internet activities when they are free, divided into two groups: that is youngsters (18-26 group) and the elderly people (60-70 age group). Overall, it is clear that the two age groups have different preferences of internet activities.
First and foremost, the younger age group spends a majority of their time on social networking (24%) compared to only 8% of the time elderly people spend. The older people, however, spend most of their time on making bookings for the cinema ticket or travel (29%) which is almost fourfold then the time youngsters spend on this stuff. Young people tend to access to music or films more than older people (just over one-fifth and 17% respectively).
In addition, young people use three times more in playing online games than the other age group (18% and 6% correspondingly). Interestingly, both the age groups spend approximately the same time for activities like doing research related to the health issue and making purchases online, that is 20% and 14% for the elderly people.
IELTS Writing Correction
- 1. Correct preposition Original: on Suggested revision: to Why it matters: The verb 'allocate' takes 'to' when describing how time is distributed among activities.
- 2. Use precise group label Original: that is youngsters Suggested revision: namely young adults Why it matters: This identifies the younger group clearly and avoids the awkward phrase 'that is youngsters'.
- 3. Add age group Original: 18-26 group Suggested revision: 18–26 age group Why it matters: The age range needs 'age' to form the correct noun phrase.
- 4. Use neutral age label Original: the elderly people (60-70 age group) Suggested revision: older people (the 60–70 age group) Why it matters: 'Older people' is a more natural label for the group shown in the chart.
- 5. Correct preference phrase Original: of Suggested revision: for Why it matters: The noun 'preferences' takes 'for' when naming preferred activities.
- 6. Avoid false majority Original: a majority of their time on social networking (24%) Suggested revision: the largest share of their time on social networking (24%) Why it matters: The chart shows that 24% is the largest younger-group share, but it is not a majority.
- 7. Correct social figure Original: only 8% Suggested revision: 21% Why it matters: The older group spends 21% of its internet time on social networking in the chart.
- 8. Remove extra preposition Original: on making bookings Suggested revision: making bookings Why it matters: After 'spend time', the gerund phrase should follow directly without 'on' here.
- 9. Use plural tickets Original: the cinema ticket Suggested revision: cinema tickets Why it matters: The chart describes cinema booking as a general activity, so the plural form is appropriate.
- 10. Correct booking figure Original: 29 Suggested revision: 25 Why it matters: The older group's booking segment is labelled 25% in the chart.
- 11. Correct comparison Original: almost fourfold then Suggested revision: five times Why it matters: The chart compares 25% for older people with 5% for younger people, a fivefold difference.
- 12. Use formal reference Original: stuff Suggested revision: activity Why it matters: 'This activity' is a precise academic reference to making bookings.
Suggested Rewrites
- on to
- that is youngsters namely young adults
- 18-26 group 18–26 age group
- the elderly people (60-70 age group) older people (the 60–70 age group)
- of for
- a majority of their time on social networking (24%) the largest share of their time on social networking (24%)
Why this response received Band 5.5
The response is clearly organised and uses a reasonable range of comparison language, so the main trends are easy to follow. Its principal weakness is data accuracy: several figures differ from the charts, especially older people's social networking, bookings, games, research, and purchases, while the overview is too general. Prioritise identifying the dominant and shared patterns correctly, then verify every percentage before writing comparisons.
IELTS Writing Criteria Scores
Task Achievement
The response addresses all activity categories, but its overview lacks specific key trends and many figures or comparisons are inaccurate.
State the main contrasts and similarities in the overview, then check each percentage against the charts before reporting it.
Coherence and Cohesion
The response progresses logically from an overview to grouped comparisons, although some linking is mechanical and the final paragraph becomes compressed.
Group the data around two or three clear comparison patterns and use simpler transitions between them.
Lexical Resource
There is sufficient vocabulary for describing proportions and comparisons, but several collocations are awkward or imprecise.
Use natural forms such as spend time playing, access music or films, and five times as much rather than informal or inaccurate phrasing.
Grammatical Range and Accuracy
A mix of simple and complex structures communicates the comparisons, but recurring errors in articles, prepositions, agreement, and comparison forms reduce accuracy.
Practise accurate comparative structures and proofread noun phrases and prepositions in every data sentence.
Write this task while it is fresh
Try the same task now. It helps you remember the feedback and write better next time.
IELTS Academic Writing Task 1
The charts below show the percentage of time younger and older people spend on various Internet activities in their free time (excluding email).
Your response
Write the task yourself, then compare your choices with the annotated response.