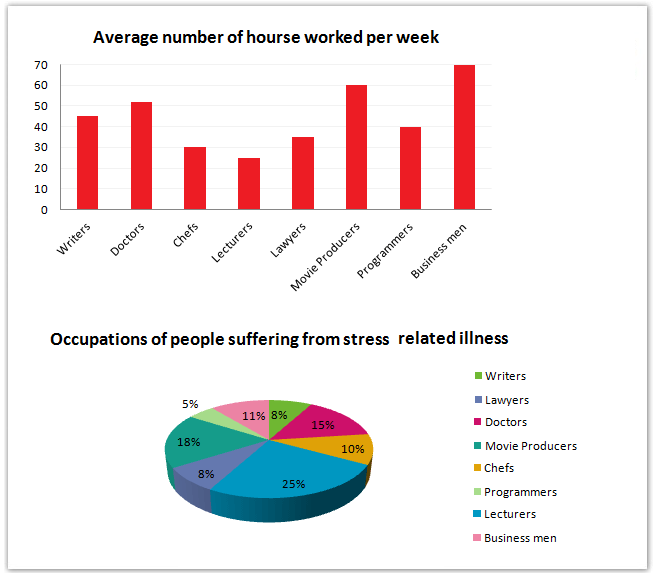
The graphs show figures relating to hours worked and stress levels amongst professionals in eight groups.
Sample Response
The illustration delineates average working hours of eight types of professionals and the percentages of them suffering from stress-related problems. Overall, despite extended working hours, business owners have fewer anxiety issues while this is highest among the teachers, who works considerably fewer hours per day. As the data suggests, businessmen work roughly 70 hours a week, higher than any other professional. Despite this longer professional engagement, their percentage of work-stress issues is lower, 11% to be precise. Doctors and movie producers both work more than 10 hours per day and their percentages of illness from work pressure account for 15 and 18 percent respectively. Writers and programmers have considerably fewer stress issues despite their more office duration than chefs, who work for only 30 hours per week but constitute 10% patients with stress-related problems. It is worth noticing that, one in four lecturers suffers from stress-related sicknesses though their working hours per week is the lowest, only 25 hours. This signifies that illness from stress from professional engagement is not directly related to the working hours of these professionals.
IELTS Writing Correction
- 1. Name both visuals Original: illustration Suggested revision: two charts Why it matters: The task contains a bar chart and a pie chart, so the plural description is more precise.
- 2. Clarify the referent Original: them Suggested revision: professionals Why it matters: A noun is needed here to identify clearly who is affected.
- 3. Match the chart label Original: anxiety issues Suggested revision: stress-related illnesses Why it matters: The visual reports stress-related illness rather than anxiety specifically.
- 4. Use the correct group Original: teachers Suggested revision: lecturers Why it matters: The category with the highest stress figure is lecturers in the visual.
- 5. Fix subject agreement Original: works Suggested revision: work Why it matters: The plural antecedent requires the plural verb form.
- 6. Correct the time unit Original: day Suggested revision: week Why it matters: The bar chart measures average weekly hours, not daily hours.
- 7. Make comparison logical Original: higher than any other professional Suggested revision: more than professionals in any other group Why it matters: The revision compares how much the groups work rather than comparing hours with a person.
- 8. Use precise chart language Original: their percentage of work-stress issues is lower Suggested revision: their rate of stress-related illness is relatively low Why it matters: This wording describes the measured proportion more accurately and naturally.
- 9. Report weekly values Original: more than 10 hours per day Suggested revision: more than 50 hours per week Why it matters: Doctors and movie producers work about 52 and 60 hours per week in the chart.
- 10. Repair the data phrase Original: their percentages of illness from work pressure account for Suggested revision: the proportions suffering from stress-related illness are Why it matters: A percentage is a value and therefore cannot account for another value in this construction.
- 11. Avoid overstating difference Original: considerably fewer stress issues Suggested revision: fewer stress-related problems Why it matters: The differences from chefs are modest for writers and larger for programmers, so the unqualified comparison is safer.
- 12. Use natural wording Original: their more office duration Suggested revision: their longer working weeks Why it matters: The original phrase is not an idiomatic way to compare working time.
Suggested Rewrites
- illustration two charts
- them professionals
- anxiety issues stress-related illnesses
- teachers lecturers
- works work
- day week
Why this response received Band 6.5
The response offers a clear overview and makes several useful cross-chart comparisons, with accurate figures for business owners, doctors, producers and lecturers. Its main limitation is incomplete and occasionally inaccurate coverage, especially the omission of lawyers and the claim that doctors and producers work more than ten hours per day when the chart reports weekly totals. Prioritise precise units and full coverage of the most relevant groups.
IELTS Writing Criteria Scores
Task Achievement
A clear overview and several accurate comparisons identify the lack of a direct relationship between working hours and stress, though one group is omitted and one unit is misreported.
Include the lawyers and consistently describe all working-time figures as weekly totals.
Coherence and Cohesion
The information progresses logically from an overview to selected comparisons, but presenting everything in one dense paragraph weakens the organisation.
Separate the overview from two logically grouped detail paragraphs, such as longer-hour and shorter-hour occupations.
Lexical Resource
A varied vocabulary supports comparison, although phrases such as more office duration and constitute 10% patients are imprecise or unnatural.
Use established data-reporting collocations such as work longer hours and account for 10% of stress-related cases.
Grammatical Range and Accuracy
The response uses a good range of complex structures, but agreement errors and a few awkward constructions reduce control.
Check subject-verb agreement carefully, especially in clauses such as teachers who work and their working hours are.
Write this task while it is fresh
Try the same task now. It helps you remember the feedback and write better next time.
IELTS Academic Writing Task 1
The graphs show figures relating to hours worked and stress levels amongst professionals in eight groups.
Your response
Write the task yourself, then compare your choices with the annotated response.