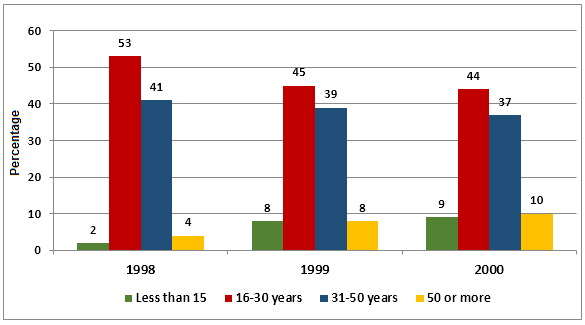
The graph shows Internet Usage in Taiwan by Age Group, 1998-2000. Who Uses the Internet in Taiwan?
Sample Response
The column graph depicts the proportion of Taiwanese internet users categorising them in four different age groups between 1998 and 2000. Generally speaking, young Taiwanese internet users were significantly higher than the internet users from other age groups. In 1998, 53% of the total Taiwanese internet users were between 16 and 30 years old. This figure was significantly higher, by 12% than those aged 31-50 years old. Internet usage in minors and those over 50 years old were less than 5%. Next year, the percentage of internet users dropped by 2-8%, except for those less than 15 years old. Their rate raised by fourfold and for those over 50 years old, doubled. In 2000, the figures for age groups 16-30 and 31-50 went down slightly by 1-2%, whereas it increased at the same rate for those aged less than 15 and over 50. Based on the information given, it can be deduced that the proportion of age groups using the internet in Taiwan minimally changed in a span of 3 years. It is also noticeable that while internet usage in teens and adults dropped slightly, the figures for both children and elders grew by almost twofold.
IELTS Writing Correction
- 1. Fix comparison phrase Original: higher, by 12% Suggested revision: higher by 12 percentage points Why it matters: No comma is needed, and the difference between two percentages is expressed in percentage points.
- 2. Compare like with like Original: than those aged 31-50 years old Suggested revision: than the figure for users aged 31–50 Why it matters: A numerical figure must be compared with another figure, not directly with people.
- 3. Name the measured share Original: Internet usage in minors Suggested revision: The proportions of users aged under 15 Why it matters: The bars show shares of all internet users rather than usage levels within an age group.
- 4. Match age category Original: and those over 50 years old were Suggested revision: and those aged 50 or over were Why it matters: This wording accurately reflects the chart's “50 or more” category.
- 5. Use formal time link Original: Next year Suggested revision: The following year Why it matters: This is a clearer formal reference to 1999.
- 6. Use percentage points Original: 2-8% Suggested revision: 2–8 percentage points Why it matters: The changes are differences between percentage shares, so they are measured in percentage points.
- 7. Use concise age label Original: those less than 15 years old Suggested revision: users aged under 15 Why it matters: This is the concise standard form for the youngest age category.
- 8. Use intransitive verb Original: raised Suggested revision: rose Why it matters: A rate rises by itself; “raise” requires an object.
- 9. Fix multiplier phrase Original: by fourfold Suggested revision: fourfold Why it matters: “Rose fourfold” does not take the preposition “by.”
- 10. Complete second clause Original: and for those over 50 years old, doubled Suggested revision: while the figure for those aged 50 or over doubled Why it matters: The original coordinated clause lacks a grammatical subject.
- 11. Report changes precisely Original: went down slightly by 1-2% Suggested revision: fell by 1–2 percentage points Why it matters: The 2000 decreases were one and two percentage points, respectively.
- 12. Fix number and accuracy Original: whereas it increased at the same rate Suggested revision: whereas the other two figures rose by one and two percentage points respectively Why it matters: Two figures require a plural reference, and their increases were not the same.
Suggested Rewrites
- higher, by 12% higher by 12 percentage points
- than those aged 31-50 years old than the figure for users aged 31–50
- Internet usage in minors The proportions of users aged under 15
- and those over 50 years old were and those aged 50 or over were
- Next year The following year
- 2-8% 2–8 percentage points
Why this response received Band 6.0
The response identifies the dominant 16–30 group and follows the three years in a generally clear sequence, with several accurate starting values. Its main weakness is the description of change: the 1999 exception omits the over-50 group, the 2000 increases are not equal, and the final growth claims are overstated. Prioritise calculating each age group’s change separately and distinguishing percentage points from proportional growth.
IELTS Writing Criteria Scores
Task Achievement
The main age pattern and several figures are accurate, but multiple year-to-year changes and the concluding growth comparison are misstated.
Track each age group across all three bars and calculate its absolute percentage-point change before summarising the trend.
Coherence and Cohesion
The response progresses chronologically and uses a recognisable overview, but the single paragraph and contradictory final summary weaken coherence.
Separate the overview from details and ensure the conclusion synthesises rather than conflicts with the preceding yearly comparisons.
Lexical Resource
Trend vocabulary is varied, but inaccurate age labels and word choices such as ‘raised’ and ‘elders’ reduce precision.
Retain the chart’s exact age-group labels and use ‘rose’, ‘fell’, ‘doubled’, or ‘increased fourfold’ accurately.
Grammatical Range and Accuracy
Meaning is generally recoverable, but agreement, comparison, pronoun-reference, punctuation, and verb-form errors occur frequently.
Give each age group a clear plural subject and check that every pronoun and comparative phrase refers to the intended figure.
Write this task while it is fresh
Try the same task now. It helps you remember the feedback and write better next time.
IELTS Academic Writing Task 1
The graph shows Internet Usage in Taiwan by Age Group, 1998-2000. Who Uses the Internet in Taiwan?
Your response
Write the task yourself, then compare your choices with the annotated response.