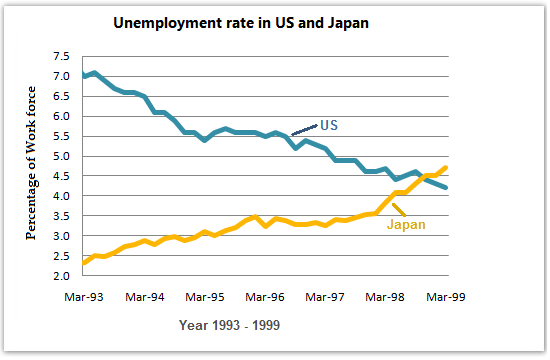
The graph below shows the unemployment rates in the US and Japan between March 1993 and March 1999.
Sample Response
The line graph compares the proportion of unemployed people in the US and Japan through the period from March 1993 to March 1999.
It is obvious that the unemployment rates of these two countries changed oppositely - while it decreased in the USA, it increased in Japan.
The percentage of the US tended to decrease over the years. However, at the same time, unfortunately, Japan witnessed the rapid growth in the rates. Nevertheless, in 1999, both nations almost had the same percentage, which means the lowest figures of the US were equal to the highest ones of Japan.
In March 1993, the proportion of unemployment in the US was a bit off 7% whereas that of Japan was about 2.5%. It was marked in 1998 when Japan's rate reached the highest point of approximately 5.2%. The contradiction happened to the US: its rate went to the lowest of 4.8%.
Although the processes of figures changing of these countries were totally opposite, the last numbers, amazingly, turned out to be extremely close. In March 1999, the rates of unemployment in the USA and Japan stood still at about 5.1% and 4.9% respectively.
IELTS Writing Correction
- 1. Use natural time phrase Original: through Suggested revision: over Why it matters: The preposition “over” is the natural choice for a span of time.
- 2. Clarify opposing trends Original: changed oppositely Suggested revision: moved in opposite directions Why it matters: “Changed oppositely” is not a natural description of contrasting trends.
- 3. Fix pronoun reference Original: while it decreased in the USA, it increased in Japan Suggested revision: while the rate decreased in the USA, it increased in Japan Why it matters: The singular pronoun needs a clear singular antecedent rather than the plural “rates.”
- 4. Name the measured rate Original: The percentage of the US Suggested revision: The US unemployment rate Why it matters: The chart measures unemployment rates, not a percentage belonging to the country.
- 5. Remove cluttered linking Original: However, at the same time, unfortunately, Suggested revision: Meanwhile, Why it matters: One neutral linker expresses the simultaneous contrast without redundancy or subjective language.
- 6. Describe trend accurately Original: the rapid growth Suggested revision: an overall increase Why it matters: Japan's rate rose overall but fluctuated, so “rapid growth” overstates the pattern.
- 7. Use singular reference Original: in the rates Suggested revision: in its unemployment rate Why it matters: The sentence refers to Japan's single unemployment rate.
- 8. Show endpoint clearly Original: Nevertheless, in 1999 Suggested revision: By March 1999 Why it matters: The original linker does not express the time relationship between the two trends.
- 9. Use precise comparison Original: same percentage Suggested revision: similar unemployment rates Why it matters: The comparison concerns two close rates rather than one shared percentage.
- 10. Use singular rate Original: lowest figures of the US Suggested revision: lowest US rate Why it matters: One unemployment series reaches a single low point.
- 11. Use singular rate Original: highest ones of Japan Suggested revision: highest Japanese rate Why it matters: This refers to the high point of one Japanese unemployment series.
- 12. State value precisely Original: a bit off 7% Suggested revision: just over 7% Why it matters: The US line begins slightly above 7%, not an unspecified distance from it.
Suggested Rewrites
- through over
- changed oppositely moved in opposite directions
- while it decreased in the USA, it increased in Japan while the rate decreased in the USA, it increased in Japan
- The percentage of the US The US unemployment rate
- However, at the same time, unfortunately, Meanwhile,
- the rapid growth an overall increase
Why this response received Band 6.0
The response clearly identifies the opposing national trends and organises its comparisons into a usable overview and detail sections. Its main limitation is numerical accuracy: the reported 1998 peaks and lows are unsupported, and the March 1999 figures should be about 4.2% for the US and 4.7% for Japan rather than 5.1% and 4.9%. Prioritise reading values directly from the axes before describing turning points.
IELTS Writing Criteria Scores
Task Achievement
The overview correctly captures the opposing trends and eventual convergence, but several late-period dates and values are inaccurate.
Use the horizontal and vertical axes to verify each endpoint, peak, and low before including exact figures.
Coherence and Cohesion
Paragraphing and broad progression are clear, although the overview is repeated and some connectors do not express the intended relationship.
State the main trends once, then organise the details chronologically with direct comparisons at the start and end.
Lexical Resource
There is some range for trends and comparisons, but frequent awkward collocations such as ‘the contradiction happened’ reduce naturalness and precision.
Use standard chart phrases including ‘the rate fell’, ‘reached a low’, ‘rose steadily’, and ‘the figures converged’.
Grammatical Range and Accuracy
The response attempts varied complex structures, but recurring pronoun, article, noun-phrase, and adverb-placement errors remain noticeable.
Keep each country as the explicit subject of its rate and simplify sentences containing multiple inserted adverbs or comparisons.
Write this task while it is fresh
Try the same task now. It helps you remember the feedback and write better next time.
IELTS Academic Writing Task 1
The graph below shows the unemployment rates in the US and Japan between March 1993 and March 1999.
Your response
Write the task yourself, then compare your choices with the annotated response.