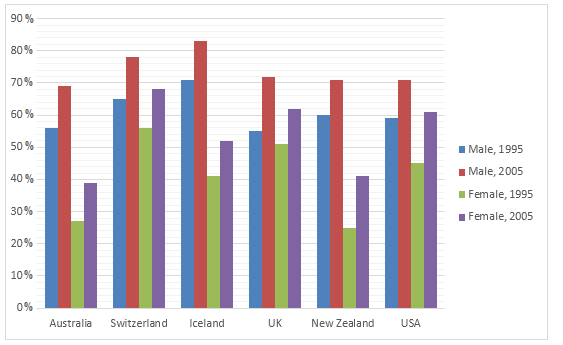
The graph below shows information on employment rates across 6 countries in 1995 and 2005. Employment Rates by Country, 1995-2005
Sample Response
The supplied bar chart compares the employment rate among men and women workers in 1995 and 2005 in six countries across the globe. It is clear that in 1995, the employment rates in Iceland and Switzerland were comparatively higher than other countries and more men were employed than that of women in the given countries. Male employment rates in Switzerland and Iceland was over 65% while it was exactly 60% in New Zealand in 1995. In this year about 58% Australian male was employed while in the USA it was just below 60%. Finally, in the UK about 55% males were employed. On the other side, women employment rate in this year was comparatively lower (only 27-28%) in Australia and New Zealand. Women in Switzerland had the highest employment rate in this year which was approximately 58%. After 10 years, the employment rate, both for woman and men, increased and the highest employment rate for men could be observed in Iceland (82%) and lowest in Australia (69%). Similarly, the highest women employment rate was in Switzerland (68%) and lowest in Australia (38%). Though the percentage of women employment increased in 2005, men were still ahead of women in employment sectors in these six countries.
IELTS Writing Correction
- 1. Use natural comparison Original: among men and women workers Suggested revision: for male and female workers Why it matters: Employment rates are more naturally described as rates for male and female workers.
- 2. Complete the comparison Original: than other countries Suggested revision: than those in the other countries Why it matters: The comparison requires a pronoun referring to the employment rates.
- 3. Fix comparative form Original: than that of women Suggested revision: than women Why it matters: The phrase incorrectly compares employed men with the rate of women.
- 4. Use plural agreement Original: was Suggested revision: were Why it matters: The plural subject "rates" requires the plural verb "were".
- 5. Add percentage preposition Original: about 55% males Suggested revision: about 55% of males Why it matters: A percentage before a plural count noun requires "of".
- 6. Use contrast linker Original: On the other side Suggested revision: By contrast Why it matters: "By contrast" clearly introduces the comparison with female employment.
- 7. Fix noun phrase Original: women employment rate in this year Suggested revision: the female employment rate that year Why it matters: Use an adjective before "employment rate" and a natural time reference.
- 8. Clarify relative level Original: lower Suggested revision: low Why it matters: "Low" accurately describes the level without leaving the comparison incomplete.
- 9. Fix both construction Original: both for woman and men Suggested revision: for both women and men Why it matters: "Both" should directly introduce the two coordinated plural nouns.
- 10. Use concise reporting Original: highest employment rate for men could be observed Suggested revision: highest male employment rate was recorded Why it matters: This is a clearer and more concise way to report a chart value.
- 11. Add missing article Original: and lowest in Australia (69%) Suggested revision: and the lowest in Australia (69%) Why it matters: The superlative noun phrase requires the definite article.
- 12. Use adjective form Original: women Suggested revision: female Why it matters: "Female" is the appropriate adjective modifying "employment rate".
Suggested Rewrites
- among men and women workers for male and female workers
- than other countries than those in the other countries
- than that of women than women
- was were
- about 55% males about 55% of males
- On the other side By contrast
Why this response received Band 6.5
The response provides a clear overview of the gender gap and the general rise in employment, supported by several relevant country comparisons. Its main limitation is uneven coverage: the 2005 figures are reduced mainly to extremes, while a few 1995 values are only approximate or slightly inaccurate. The highest priority is to select a more balanced set of comparisons across both years and check every reported figure against the chart.
IELTS Writing Criteria Scores
Task Achievement
A clear overview and mostly accurate key figures address the task well, though coverage of 2005 is limited and several values are imprecise.
Compare more countries across both years and verify exact values, especially the 1995 figures for Australia, Switzerland, and New Zealand.
Coherence and Cohesion
The response progresses logically from an overview to 1995 details and then 2005, with generally clear referencing.
Use more natural comparative transitions and reduce repetitive time references such as repeated uses of "in this year".
Lexical Resource
The vocabulary is sufficiently varied for the task, but recurring awkward combinations reduce precision.
Use standard forms such as "female employment rate," "Australian men," and "higher than that for women" more consistently.
Grammatical Range and Accuracy
A mix of sentence structures communicates the comparisons clearly, but agreement, article, and noun-form errors recur.
Prioritise subject-verb agreement and plural control in phrases involving rates, percentages, men, and women.
Write this task while it is fresh
Try the same task now. It helps you remember the feedback and write better next time.
IELTS Academic Writing Task 1
The graph below shows information on employment rates across 6 countries in 1995 and 2005. Employment Rates by Country, 1995-2005
Your response
Write the task yourself, then compare your choices with the annotated response.