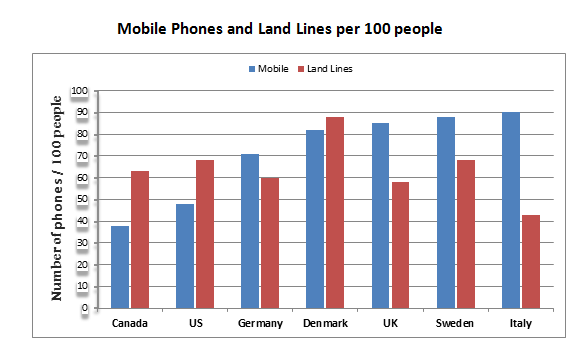
The chart shows the number of mobile phones and landlines per 100 people in selected countries.
Sample Response
The given bar graph depicts the mobile or land phone numbers per 100 people in different seven countries. The first point to note is that highest number of phones used by the people in Denmark.
It occupied almost an equal number of mobile and land phones that is 82% and 86% respectively. Canada and the USA have almost half of it users of mobile phones which are 38% and 48% respectively. 70% German people have mobile phones while other British countries like UK, Sweden and Italy have more than the number of Denmark with 85%, 88% and 90% respectively. In the case of land phones, the lowest number was in Italy with 42% and the UK with 58%. Whereas Germany, Canada and Sweden have almost equal numbers with 60%, 62% and 65% respectively.
To sum up, it is clear from the graph that, the number of mobile phones has variations, whereas land phones have average use in all the given countries.
IELTS Writing Correction
- 1. Name both measures Original: mobile or land phone numbers Suggested revision: numbers of mobile phones and landlines Why it matters: The chart presents two parallel measures, so “and” is required.
- 2. Fix adjective order Original: different seven countries Suggested revision: seven different countries Why it matters: The number should precede the descriptive adjective in this noun phrase.
- 3. Add article Original: that highest number Suggested revision: that the highest number Why it matters: The superlative noun phrase requires the definite article.
- 4. Complete passive clause Original: phones used by the people Suggested revision: phones per 100 people was recorded Why it matters: The sentence needs a finite verb and should state the chart's measurement unit.
- 5. Use correct unit Original: 70% German people have mobile phones Suggested revision: Germany had 70 mobile phones per 100 people Why it matters: The chart reports phones per 100 people, not percentages of people.
- 6. Correct country grouping Original: other British countries Suggested revision: the other countries Why it matters: Sweden and Italy are not British countries.
- 7. Add article Original: like UK Suggested revision: such as the UK Why it matters: The country name takes the definite article, and “such as” introduces examples clearly.
- 8. Fix comparison phrase Original: more than the number of Denmark Suggested revision: higher figures than Denmark Why it matters: Figures are compared with figures, not with a country itself.
- 9. Report chart units Original: with 85%, 88% and 90% respectively Suggested revision: at 85, 88 and 90 per 100 people, respectively Why it matters: These values are counts per 100 people rather than percentages.
- 10. Use concise term Original: In the case of land phones Suggested revision: For landlines Why it matters: “Landlines” is the standard concise label used for this category.
- 11. Clarify ranking Original: the lowest number was in Italy with 42% and the UK with 58% Suggested revision: Italy had the lowest figure, at 42, followed by the UK at 58 Why it matters: Only Italy has the lowest figure, and the values are counts per 100 people.
- 12. Fix sentence fragment Original: Whereas Germany, Canada and Sweden have Suggested revision: Germany, Canada and Sweden had Why it matters: Removing “Whereas” creates an independent sentence and keeps the tense consistent.
Suggested Rewrites
- mobile or land phone numbers numbers of mobile phones and landlines
- different seven countries seven different countries
- that highest number that the highest number
- phones used by the people phones per 100 people was recorded
- 70% German people have mobile phones Germany had 70 mobile phones per 100 people
- other British countries the other countries
Why this response received Band 5.5
The response reports many category figures and generally makes the chart's subject understandable. However, the overview does not accurately identify the dominant cross-country patterns, some landline data are incorrect or omitted, and frequent grammatical errors make several comparisons awkward. Prioritise a precise overview highlighting the highest figures and where mobiles exceed landlines, then verify each value and revise sentence structure.
IELTS Writing Criteria Scores
Task Achievement
Many mobile figures are accurately reported, but the overview is vague, Sweden's landline value is misstated, and important cross-country patterns are not identified.
State that Italy has the highest mobile figure, Denmark the highest landline figure, and mobiles exceed landlines in Germany, the UK, Sweden, and Italy.
Coherence and Cohesion
The response has an introduction, detail paragraph, and conclusion, but comparisons are loosely grouped and the "Whereas" fragment disrupts progression.
Organise details by countries where landlines are higher versus those where mobiles are higher, using complete linking sentences.
Lexical Resource
There is enough vocabulary to describe the chart, but inaccurate expressions such as "different seven countries," "It occupied," and "British countries" reduce precision.
Use accurate chart language such as "seven countries," "Denmark recorded," and "selected countries" throughout.
Grammatical Range and Accuracy
Meaning is generally recoverable, but frequent errors in articles, word order, agreement, pronoun reference, and sentence boundaries reduce control.
Build each comparison with a clear subject and verb, and check articles and agreement before adding figures.
Write this task while it is fresh
Try the same task now. It helps you remember the feedback and write better next time.
IELTS Academic Writing Task 1
The chart shows the number of mobile phones and landlines per 100 people in selected countries.
Your response
Write the task yourself, then compare your choices with the annotated response.