The table below shows social and economic indicators for four countries in 1994, according to United Nations statistics. Describe the information shown below in your own words. What implications do the indicators have for the countries? Indicators Canada Japan Peru Zaire Annual income per person (in $US) Life expectancy at birth Daily calorie supply per person Adult literacy rate (%)
Same question Compare 3 different answers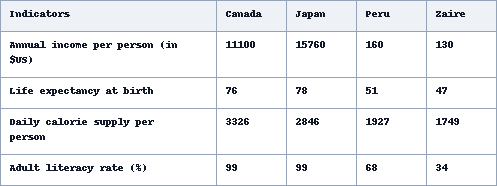
Sample Response
The given table depicts some striking information according to the statistics of the United Nations which represents social and economic indicators of four particular countries in the year 1994. According to the provided table, it can be seen clearly that, living standards of Canadian and Japanese citizens were far better than that of people of Peru and Zaire.
As is presented in the table, initially, annual incomes of Canadian and Japanese people were much higher with 11100 and 15760 USD per person in 1994 while people of Peru and Zaire had only 260 and 130 USD per person respectively. In addition, life expectancy at birth in Canada and Japan was 76 and 78 years whereas it was only 51 and 47 only in Peru and Zaire. As is observed from the given data, daily calorie supply in Canada and Japan was 3326 and 2846 per person while this ratio in Peru and Zaire was almost half, with 1927 and 1749 per person. Again, the adult literacy rate in both Canada and Japan was exactly same - 99%, while other two countries namely Peru and Zaire had far less adult literacy rates which were 68 and 34 percents respectively.
In summary, citizens of Canada and Japan had incredibly better living standards than that of Peru and Zaire in all indicated areas in the statistics.
IELTS Writing Correction
- 1. Remove misplaced comma Original: that, living Suggested revision: that the living Why it matters: No comma should separate the reporting clause from its subject.
- 2. Fix plural comparison Original: that of people of Peru and Zaire Suggested revision: those of people in Peru and Zaire Why it matters: The plural pronoun must agree with living standards, and in is the natural country preposition.
- 3. Remove time-sequence marker Original: initially Suggested revision: Delete Why it matters: The table has only one year, so this sequencing word creates a false temporal progression.
- 4. Introduce figures clearly Original: much higher with Suggested revision: much higher, at Why it matters: At is the natural preposition for reporting the values of an indicator.
- 5. Format currency values Original: 11100 and 15760 USD Suggested revision: $11,100 and $15,760 Why it matters: Standard currency symbols and thousands separators make the figures easier to read.
- 6. Correct Peru income Original: 260 and 130 USD Suggested revision: $160 and $130 Why it matters: The table gives Peru's annual income as $160, not $260, and Zaire's as $130.
- 7. Remove repeated limiter Original: 51 and 47 only Suggested revision: 51 and 47 Why it matters: Only already appears earlier in the clause and should not be repeated.
- 8. Name the figures Original: this ratio Suggested revision: the corresponding figures Why it matters: Daily calorie supply is reported as an amount rather than a ratio.
- 9. Avoid inaccurate proportion Original: almost half Suggested revision: considerably lower Why it matters: The Peru and Zaire values are roughly three-fifths, rather than half, of the corresponding higher figures.
- 10. Add article and preposition Original: was exactly same - 99% Suggested revision: was exactly the same at 99% Why it matters: Same requires the definite article, and at correctly introduces the percentage.
- 11. Add definite article Original: while other two Suggested revision: while the other two Why it matters: The definite article is required because the two remaining countries are specified.
- 12. Set off naming phrase Original: countries namely Peru and Zaire Suggested revision: countries, namely Peru and Zaire, Why it matters: Commas should enclose the parenthetical phrase naming the countries.
Suggested Rewrites
- that, living that the living
- that of people of Peru and Zaire those of people in Peru and Zaire
- initially Delete
- much higher with much higher, at
- 11100 and 15760 USD $11,100 and $15,760
- 260 and 130 USD $160 and $130
Why this response received Band 7.0
The response gives a clear overall comparison and systematically reports every indicator, making the contrast between Canada and Japan and the two lower-performing countries easy to follow. Its main weakness is precision: Peru's annual income is misstated as $260 rather than $160, and some phrasing is awkward or repetitive. Prioritise exact data checking and more natural comparative language.
IELTS Writing Criteria Scores
Task Achievement
The overview and comparisons cover all four indicators effectively, with one notable factual error in Peru's annual income.
Verify every figure against the table, especially Peru's income of $160, while preserving the strong cross-country comparisons.
Coherence and Cohesion
Information is logically organised around a clear overview, a detailed comparative paragraph, and a concise conclusion.
Reduce repetitive framing such as “As is presented” and “As is observed” to make progression more natural.
Lexical Resource
The vocabulary is varied and generally appropriate, although terms such as “ratio,” “percents,” and “incredibly” are imprecise here.
Use exact academic phrasing such as “calorie supply,” “percent,” and “substantially higher living standards.”
Grammatical Range and Accuracy
Complex comparative sentences are handled successfully overall, but agreement, article, punctuation, and comparison errors recur.
Check noun agreement and comparison structures, for example “living standards ... better than those in Peru and Zaire.”
Write this task while it is fresh
Try the same task now. It helps you remember the feedback and write better next time.
IELTS Academic Writing Task 1
The table below shows social and economic indicators for four countries in 1994, according to United Nations statistics. Describe the information shown below in your own words. What implications do the indicators have for the countries? Indicators Canada Japan Peru Zaire Annual income per person (in $US) Life expectancy at birth Daily calorie supply per person Adult literacy rate (%)
Your response
Write the task yourself, then compare your choices with the annotated response.