The table below shows social and economic indicators for four countries in 1994, according to United Nations statistics. Describe the information shown below in your own words. What implications do the indicators have for the countries? Indicators Canada Japan Peru Zaire Annual income per person (in $US) Life expectancy at birth Daily calorie supply per person Adult literacy rate (%)
Same question Compare 3 different answers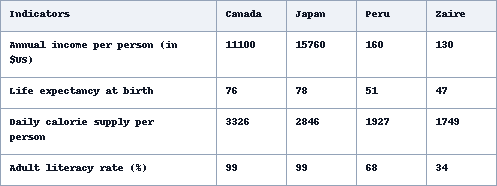
Sample Response
The supplied table gives data provided by the United Nations on the 4 major social and economic indicators of four countries for the year 1994. As is observed from the given data, Canada and Japan were two countries with really rich social and economic indications whereas Peru and Zaire were two countries where life expectancy and other social and economic factors were very poor in the year 1994. Canada and Japan had both 99% adult literacy rate and their life expectancy was more than 75. Besides, annual incomes per person in these two countries were much higher, more than 11 thousand and 15 thousand respectively. Finally, the daily calorie supplies for the people of these 2 countries were more than 3300 and 2800. Totally opposite scenarios can be observed in Peru and Zaire. The latter two countries had only 68% and 34% adult literates and the life expectancy was much less than the previous two countries. Finally, the calorie supply per person and life expectancy was significantly less in these two countries. These indicators show a poor living standard in these two countries. In summary, Canada and Japan both had a rich life standard while it was very poor in Peru and Zaire.
IELTS Writing Correction
- 1. Use precise description Original: 4 major social and economic indicators Suggested revision: four social and economic indicators Why it matters: The table presents four indicators, but it does not identify them as major.
- 2. Correct word choice Original: really rich social and economic indications Suggested revision: strong social and economic indicators Why it matters: Indications is the wrong noun for the measures shown, and rich is an unsuitable description of the figures.
- 3. Use concise contrast Original: Totally opposite scenarios can be observed Suggested revision: By contrast, substantially lower figures can be observed Why it matters: A direct contrast marker states the relationship between the two country groups more precisely.
- 4. Use rate construction Original: 68% and 34% adult literates Suggested revision: adult literacy rates of 68% and 34% Why it matters: Percentages describe literacy rates rather than counts of adult literates.
- 5. Fix comparison form Original: was much less than the previous two countries Suggested revision: was much lower than in the previous two countries Why it matters: A numerical level is lower, and the comparison requires in before the country group.
- 6. Match compound subject Original: was significantly less Suggested revision: were significantly lower Why it matters: Calorie supply and life expectancy form a plural subject, and numerical values are lower rather than less.
- 7. Use natural collocation Original: a rich life standard Suggested revision: a high standard of living Why it matters: High standard of living is the standard English collocation for this idea.
- 8. Use concise time phrase Original: for the year 1994 Suggested revision: in 1994 Why it matters: In 1994 expresses the date more concisely.
- 9. Use direct reporting Original: As is observed from the given data Suggested revision: As the data show Why it matters: The direct reporting clause is clearer and less wordy.
- 10. Remove redundant wording Original: Canada and Japan were two countries Suggested revision: Canada and Japan Why it matters: The reader already knows that Canada and Japan are countries.
- 11. Describe figures precisely Original: where life expectancy and other social and economic factors were very poor Suggested revision: where life expectancy and the other social and economic indicators were very low Why it matters: Indicators and numerical levels are low rather than poor.
- 12. Name metric accurately Original: the daily calorie supplies Suggested revision: the daily calorie supply figures Why it matters: The table presents one calorie-supply measure for each country.
Suggested Rewrites
- 4 major social and economic indicators four social and economic indicators
- really rich social and economic indications strong social and economic indicators
- Totally opposite scenarios can be observed By contrast, substantially lower figures can be observed
- 68% and 34% adult literates adult literacy rates of 68% and 34%
- was much less than the previous two countries was much lower than in the previous two countries
- was significantly less were significantly lower
Why this response received Band 6.5
The response presents a clear overall contrast between Canada and Japan and the two less developed countries, supported by several accurate figures for the stronger performers. Its main weakness is incomplete coverage of Peru and Zaire, whose income, calorie and life-expectancy data are mostly left unquantified, while some wording is awkward. Prioritise balanced, precise comparison by selecting key figures from all four indicators and grouping the countries more systematically.
IELTS Writing Criteria Scores
Task Achievement
A clear overview and several accurate figures establish the main contrast, but most numerical detail for Peru and Zaire is omitted.
Include their income, life-expectancy and calorie figures and compare these directly with Canada and Japan.
Coherence and Cohesion
The information progresses logically from the overview to the higher- and lower-performing countries, though the single paragraph and repeated closing comparison weaken organisation.
Separate the overview and detailed comparisons into distinct paragraphs and avoid restating the same contrast at the end.
Lexical Resource
Vocabulary is adequate for comparison, but collocations such as “social and economic indications,” “adult literates,” and “rich life standard” are imprecise.
Use natural reporting phrases such as “social and economic indicators,” “adult literacy rates,” and “standard of living.”
Grammatical Range and Accuracy
The response uses several complex sentences successfully, with only occasional article, agreement and comparative-structure problems.
Improve control of plural nouns and comparative structures, particularly when referring jointly to data from two countries.
Write this task while it is fresh
Try the same task now. It helps you remember the feedback and write better next time.
IELTS Academic Writing Task 1
The table below shows social and economic indicators for four countries in 1994, according to United Nations statistics. Describe the information shown below in your own words. What implications do the indicators have for the countries? Indicators Canada Japan Peru Zaire Annual income per person (in $US) Life expectancy at birth Daily calorie supply per person Adult literacy rate (%)
Your response
Write the task yourself, then compare your choices with the annotated response.