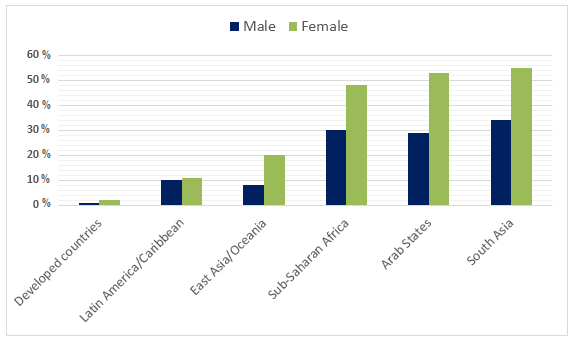
The chart below shows estimated world illiteracy rates by region and by gender for the year 2000. Estimated World illiteracy rates, by region and gender, 2000.
Sample Response
The given bar graph shows the illiteracy rates of different regions of the world both for male and female for the year 2000. As is observed from the graph, South Asian, Arab and African countries had a very high rate of illiteracy while this percentage was very low in developed countries as well as in the Latin American countries. Besides, it is also observed that female illiteracy rate was higher than male illiteracy rate in all part of the world.
As is presented in the graph, the illiteracy rate among female was higher than male in all parts of the world. The illiteracy rate in South Asian, Arab states and in Sub-Saharan Africa was alarmingly higher than any part of the world. More than 50 female in South Asian and Arab countries were illiterate while this percentage was only 1 in developed countries. Around 30% males were illiterate in these two regions while this percentage was less than 1 in developed countries. The illiteracy rate in Sub-Saharan African countries was similar to the South Asian and Arab countries. East Asia and Oceania had less than 20% illiterate people while this rate was around 10% in Latin America/ Caribbean countries. Finally, in developed countries, most of the people were literate as they had a very small percentage of illiterate people which amounted less than 1%. In summary, the South Asian, Arabian and Sub-Saharan countries had a severe illiteracy rate compared to any part of the world and female illiteracy rate was higher than the male illiteracy rate all over the world.
IELTS Writing Correction
- 1. Use plural nouns Original: both for male and female Suggested revision: for both males and females Why it matters: The chart compares groups of males and females, so both count nouns should be plural.
- 2. Name regions accurately Original: South Asian, Arab and African countries Suggested revision: South Asia, the Arab States and Sub-Saharan Africa Why it matters: These are the three regional labels used in the chart.
- 3. Include Caribbean region Original: the Latin American countries Suggested revision: Latin America and the Caribbean Why it matters: The chart category includes both Latin America and the Caribbean.
- 4. Add definite article Original: observed that female illiteracy rate was higher Suggested revision: observed that the female illiteracy rate was higher Why it matters: A singular specified rate requires the definite article.
- 5. Use plural form Original: part Suggested revision: parts Why it matters: All requires the plural count noun parts here.
- 6. Make comparison parallel Original: among female was higher than male Suggested revision: among females was higher than among males Why it matters: The two sides of the comparison need parallel plural noun phrases.
- 7. Use chart labels Original: South Asian, Arab states and in Sub-Saharan Africa Suggested revision: South Asia, the Arab States and Sub-Saharan Africa Why it matters: The replacement uses the chart's regional names and removes the unnecessary in.
- 8. Complete comparison Original: alarmingly higher than any part of the world Suggested revision: substantially higher than in any other region Why it matters: The comparison requires in and other to exclude the regions being described.
- 9. Express percentage fully Original: More than 50 female Suggested revision: More than 50% of females Why it matters: A percentage needs the percent sign and an of phrase before the population group.
- 10. Include percent unit Original: this percentage was only 1 in developed countries Suggested revision: this percentage was only about 1% in developed countries Why it matters: The chart reports a percentage, so the unit must be stated.
- 11. Add of before group Original: Around 30% males Suggested revision: Around 30% of males Why it matters: Percentages of a population take of before the group noun.
- 12. State approximate value Original: less than 1 in developed countries Suggested revision: about 1% in developed countries Why it matters: The male bar is approximately 1%, and the percent unit should be included.
Suggested Rewrites
- both for male and female for both males and females
- South Asian, Arab and African countries South Asia, the Arab States and Sub-Saharan Africa
- the Latin American countries Latin America and the Caribbean
- observed that female illiteracy rate was higher observed that the female illiteracy rate was higher
- part parts
- among female was higher than male among females was higher than among males
Why this response received Band 6.5
The response gives a clear overview of the regional extremes and consistently identifies the higher female rate, while covering every region in a logical sequence. However, several data points are expressed imprecisely or without percentage units, and recurring agreement and comparison errors reduce accuracy. The most valuable improvement is to report paired male–female percentages for each key region and proofread noun forms, articles and comparative structures.
IELTS Writing Criteria Scores
Task Achievement
The overview identifies the main regional and gender patterns, and all regions are covered, although several values are approximate, incomplete or slightly inaccurate.
Give accurate paired male and female percentages for the highest and lowest regions, including the roughly 30% versus 48% figures for Sub-Saharan Africa.
Coherence and Cohesion
The report is logically ordered from overview to regional detail, but it repeats the female-versus-male observation and relies on a limited set of linking patterns.
Remove the repeated overview point and group the high-, middle- and low-rate regions into more purposeful comparisons.
Lexical Resource
There is sufficient topic vocabulary to describe rates and regional contrasts, but several word combinations and labels are awkward or imprecise.
Use precise forms such as “women,” “men,” “South Asia” and “Arab States,” and avoid vague phrases such as “any part of the world.”
Grammatical Range and Accuracy
A range of sentence structures is attempted, but recurring article, agreement, plural and comparison errors are noticeable despite generally clear meaning.
Proofread structures such as “the rate among women was higher than that among men” and ensure every numerical statement has a grammatical percentage expression.
Write this task while it is fresh
Try the same task now. It helps you remember the feedback and write better next time.
IELTS Academic Writing Task 1
The chart below shows estimated world illiteracy rates by region and by gender for the year 2000. Estimated World illiteracy rates, by region and gender, 2000.
Your response
Write the task yourself, then compare your choices with the annotated response.