Test 3Task 1
The charts below give information on the ages of the populations of Yemen and Italy in 2000 and projections for 2050.
Summarise the information by selecting and reporting the main features, and make comparisons where relevant.
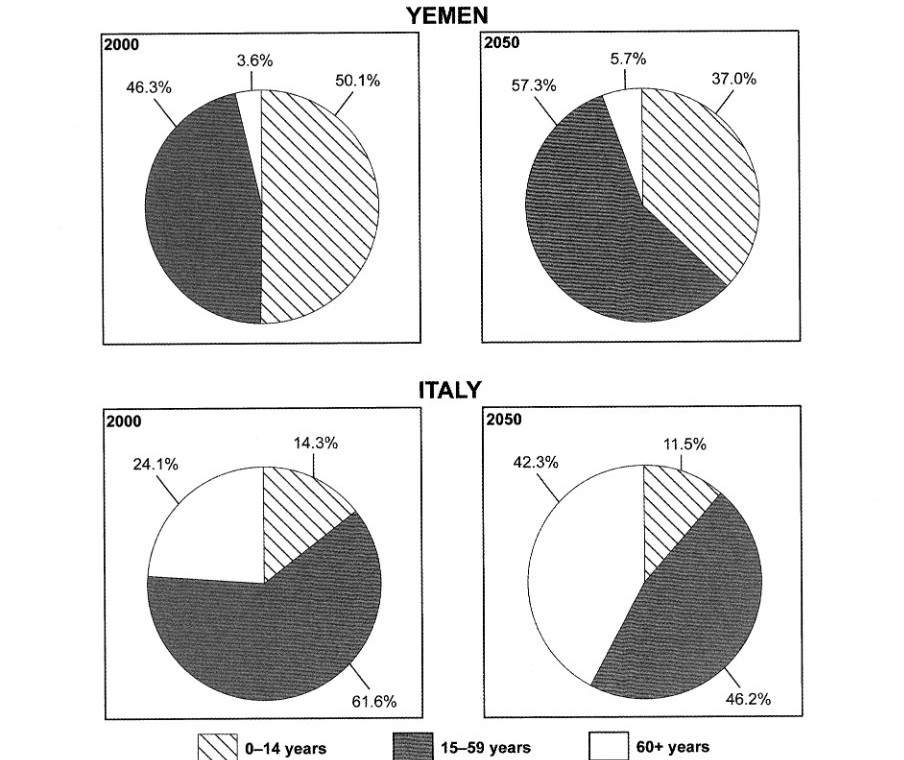
The charts below give information on the ages of the populations of Yemen and Italy in 2000 and projections for 2050.
Summarise the information by selecting and reporting the main features, and make comparisons where relevant.
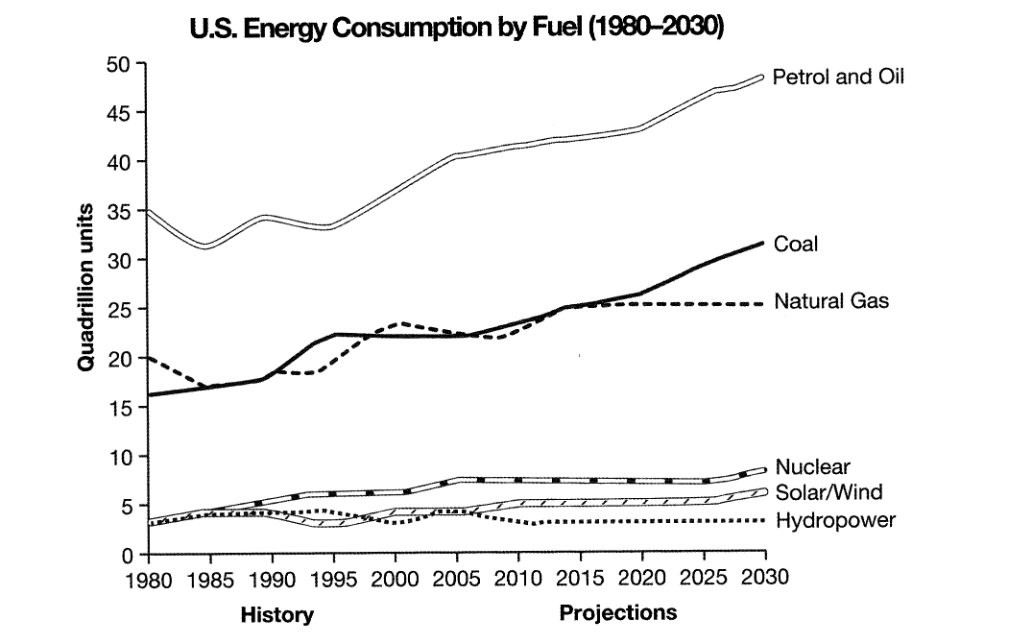
The graph below gives information from a 2008 report about consumption of energy in the USA since 1980 with projections until 2030.
Summarise the information by selecting and reporting the main features, and make comparisons where relevant.
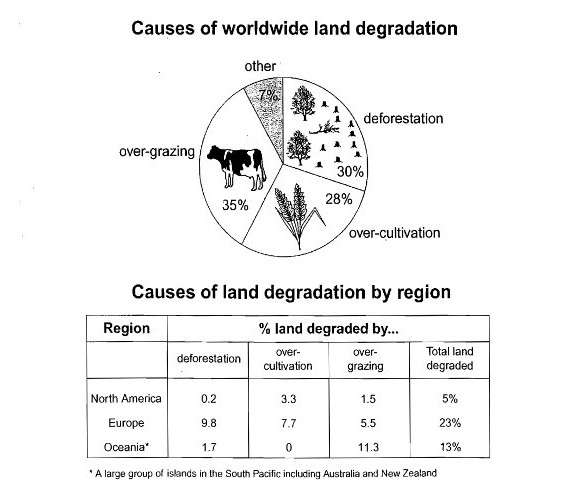
The pie chart below shows the main reasons why agricultural land becomes less productive. The table shows how these causes affected three regions of the world during the 1990s.
Summarise the information by selecting and reporting the main features, and make comparisons where relevant.
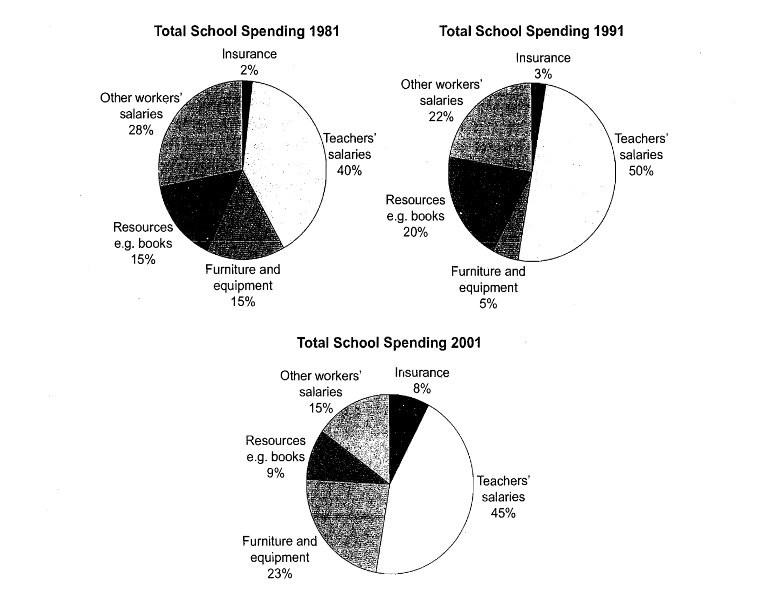
The three pie charts below show the changes in annual spending by a particular UK school in 1981, 1991 and 2001.
Summarise the information by selecting and reporting the main features, and make comparisons where relevant.
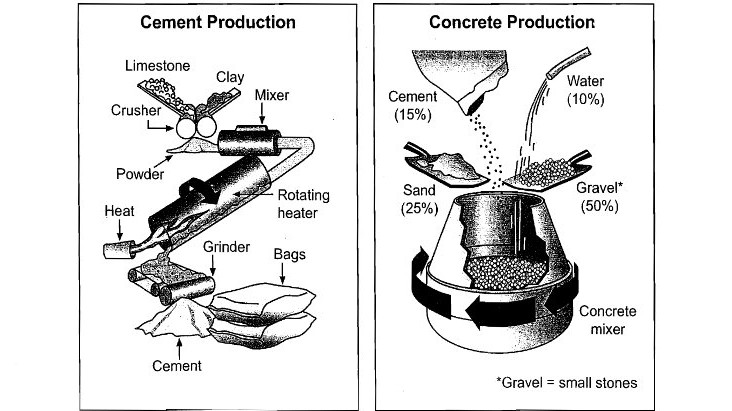
The diagrams below show the stages and equipment used in the cement-making process, and how cement is used to produce concrete for building purposes.
Summarise the information by selecting and reporting the main features, and make comparisons where relevant.
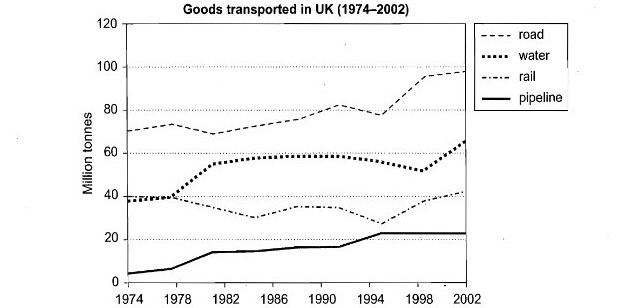
The graph below shows the quantities of goods transported in the UK between 1974 and 2002 by four different modes of transport.
Summarise the information by selecting and reporting the main features, and make comparisons where relevant.
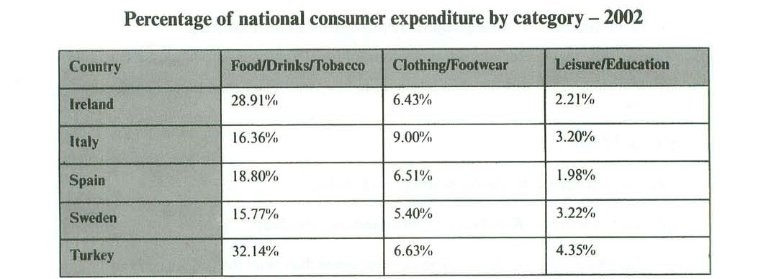
The table below gives information on consumer spending on different items in five different countries in 2002.
Summarise the information by selecting and reporting the main features, and make comparisons where relevant.
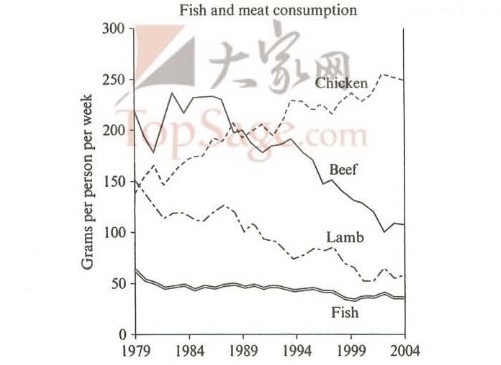
The graph below shows the consumption of fish and some different kinds of meat in a European country between 1979 and 2004.
Summarise the information by selecting and reporting the main features, and make comparisons where relevant.
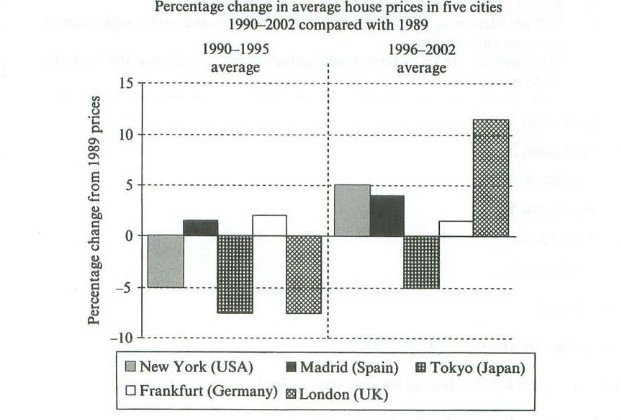
The chart below shows information about changes in average house prices in five different cities between 1990 and 2002 compared with the average house prices in 1989.
Summarise the information by selecting and reporting the main features, and make comparisons where relevant.
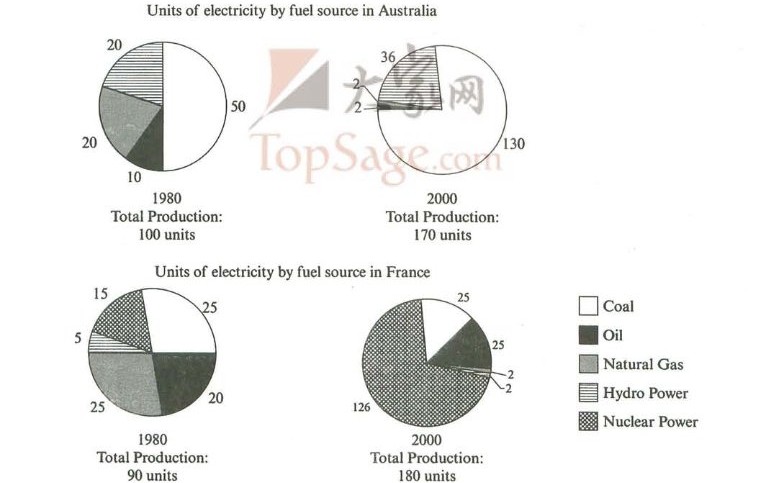
The pie charts below show units of electricity production by fuel source in Australia and France in 1980 and 2000.
Summarise the information by selecting and reporting the main features, and make comparisons where relevant.