The map below shows the changes in an American town between 1948 and 2010.
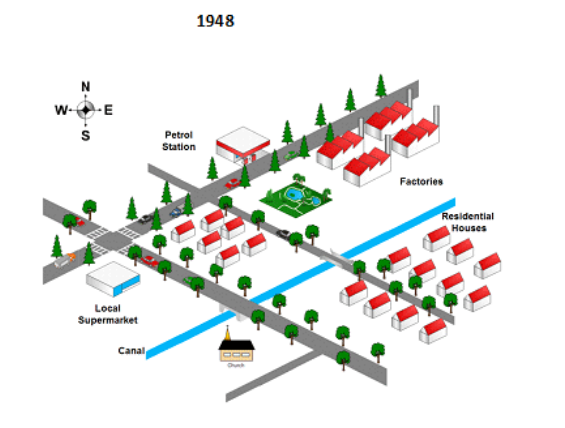
The map below shows the changes in an American town between 1948 and 2010.
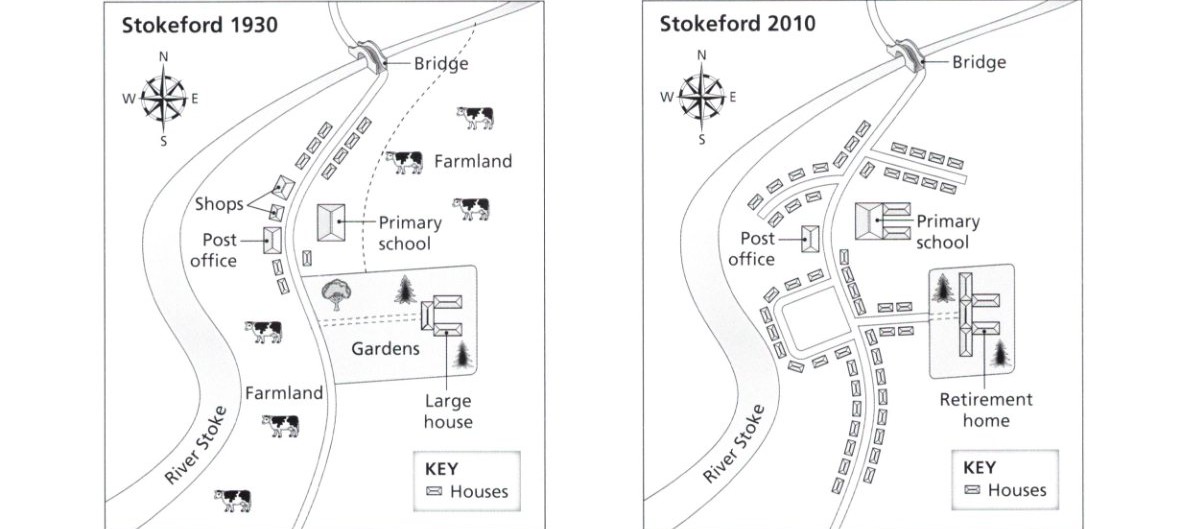
The maps below show the village of Stokeford in 1930 and in 2010. Summarise the information by selecting and reporting the main features, and make comparisons where relevant.
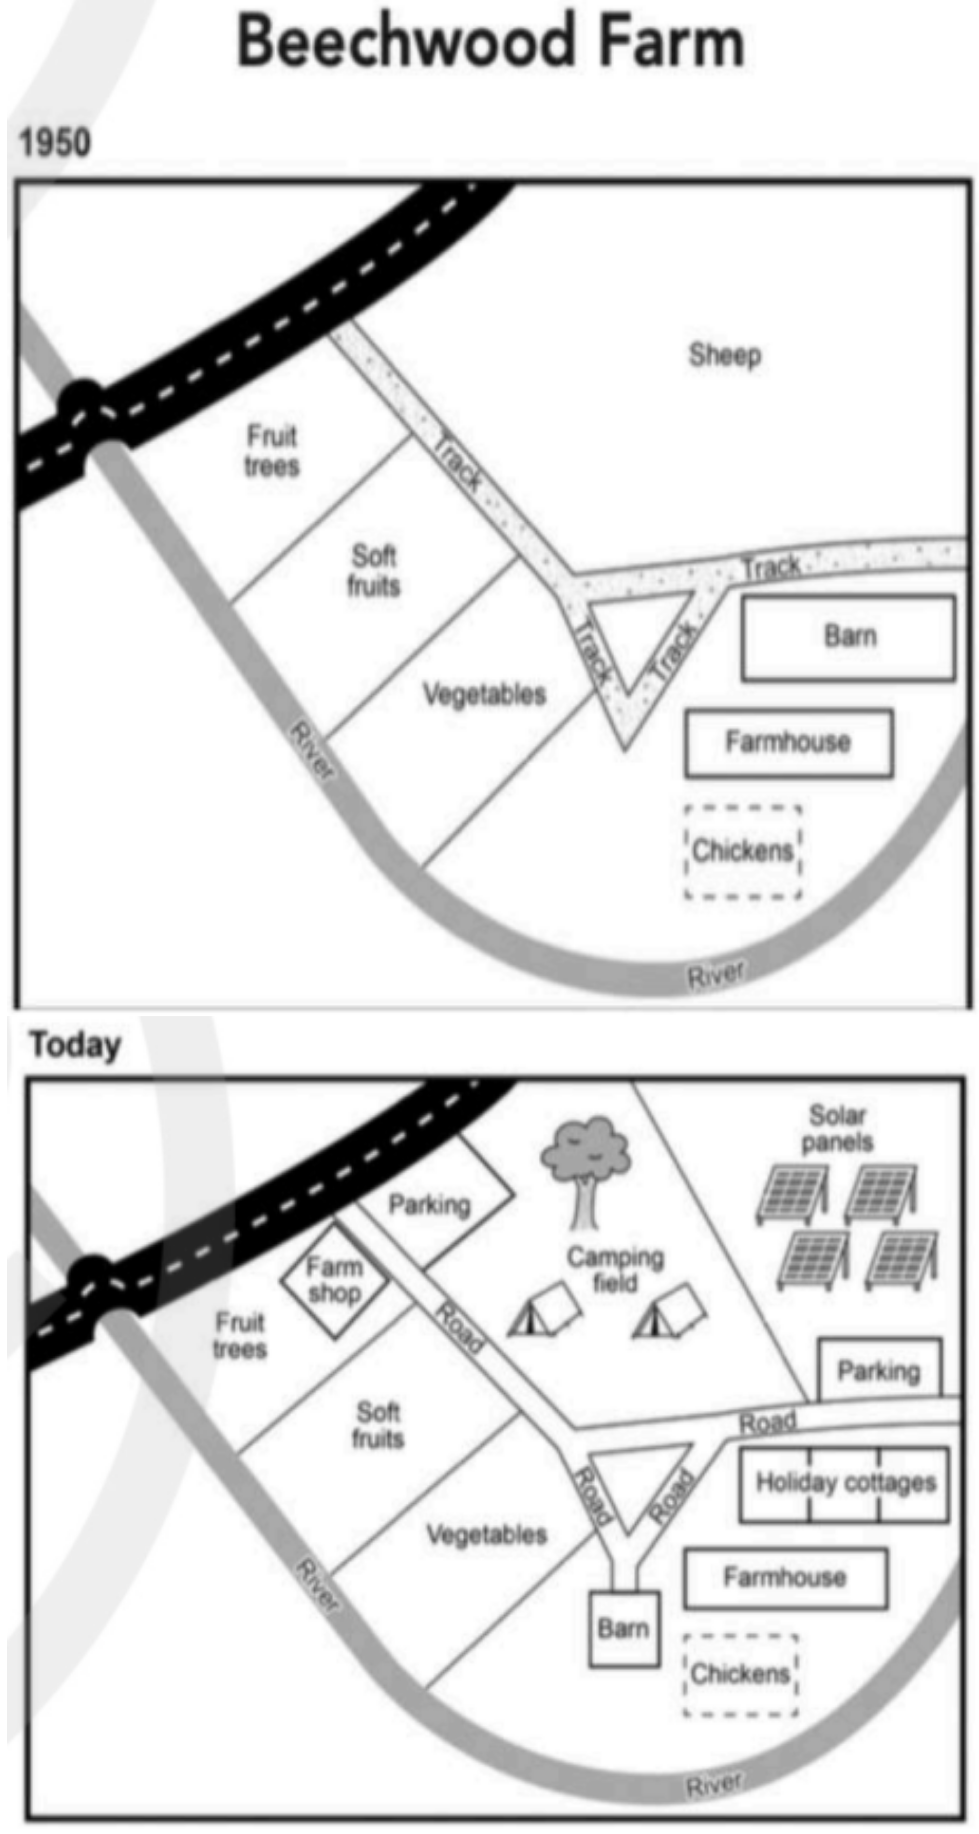
The plans below show the site of a farm in 1950 and the same site today. Summarise the information by selecting and reporting the main features, and make comparisons where relevant.
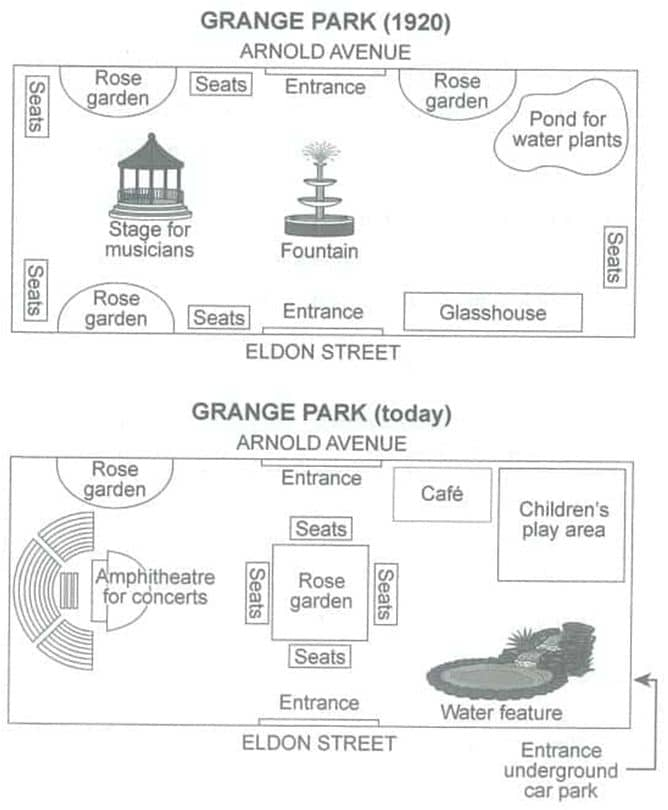
The plans below show a public park when it first opened in 1920 and the same park today. Summarise the information by selecting and reporting the main features and make comparisons where relevant.
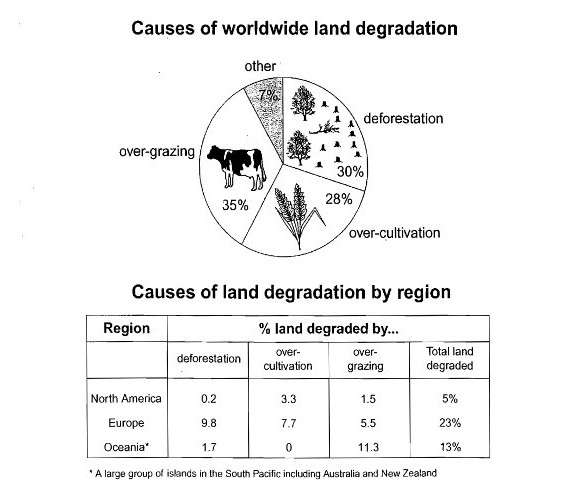
The pie chart below shows the main reasons why agricultural land becomes less productive. The table shows how these causes affected three regions of the world during the 1990s. Summarise the information by selecting and reporting the main features, and make comparisons where relevant.