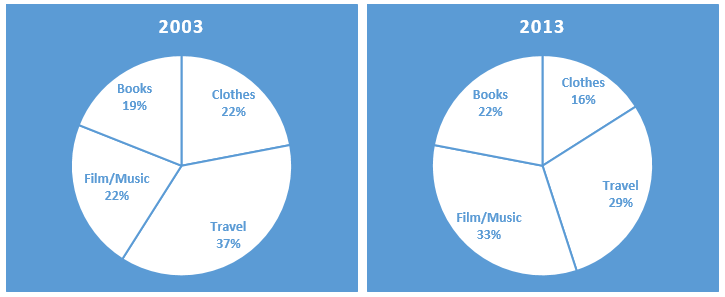
The pie charts below show the online sales for retail sectors in New Zealand in 2003 and 2013.
Sample Response
The pie charts compare online sales of clothes, books, travel services and films/music in New Zealand between 2003 and 2013. Generally speaking, online sales of books and movies/music increased in a decade while clothing and travel related services witnessed a drop in sales in New Zealand. As is given in the pie charts, online travel service’s sale ratio was the highest in 2003, precisely 37%. Clothing and ‘film & music’ each made a 22% of total sales and it was 3% higher than the online sale ratio of books. After a decade, the sale ratio of clothes dipped by 6% while travel services witnessed a drop in online sales as well. Precisely 29% of online retail sales were from travel industries. Reversely, online sales of books and films surged in 2013, reached to 22% and 33% respectively. It is worth noticing that, approximately one-thirst of all online retail sales in 2013 was for film and music industries, though, its sale volume a decade ago was less than a quarter of total online retail sales.
IELTS Writing Correction
- 1. Correct time phrase Original: increased in a decade Suggested revision: increased over the decade Why it matters: Changes between two endpoints occur over a period, not in it.
- 2. Hyphenate compound modifier Original: travel related services Suggested revision: travel-related services Why it matters: The compound adjective before the noun requires a hyphen.
- 3. Use direct trend verb Original: witnessed a drop in sales in New Zealand Suggested revision: declined Why it matters: The direct verb states the downward trend more concisely.
- 4. Use natural reference Original: As is given in the pie charts Suggested revision: As shown in the pie charts Why it matters: This is the conventional phrasing for referring to visual data.
- 5. Name the share precisely Original: online travel service’s sale ratio Suggested revision: travel services’ share of online sales Why it matters: The category represents a share of total online sales, not a sale ratio.
- 6. Integrate the figure Original: precisely Suggested revision: at Why it matters: This wording connects the exact percentage naturally to the superlative statement.
- 7. Use category share Original: sale ratio of clothes Suggested revision: share for clothing Why it matters: Share is the appropriate term for a pie-chart segment.
- 8. Use percentage points Original: dipped by 6% Suggested revision: dropped by six percentage points Why it matters: The change from 22% to 16% is six percentage points, not a six-percent relative fall.
- 9. State trend directly Original: travel services witnessed a drop in online sales as well Suggested revision: the share for travel services also fell Why it matters: The revision is more concise and keeps the pie-chart measure explicit.
- 10. Match category label Original: industries Suggested revision: services Why it matters: The chart labels the category as travel services rather than industries.
- 11. Use valid contrast Original: Reversely Suggested revision: By contrast Why it matters: Reversely is not the natural connector for contrasting category trends.
- 12. Retain full category Original: online sales of books and films Suggested revision: online sales of books and film/music Why it matters: The visual combines film and music in one category, so music should not be omitted.
Suggested Rewrites
- increased in a decade increased over the decade
- travel related services travel-related services
- witnessed a drop in sales in New Zealand declined
- As is given in the pie charts As shown in the pie charts
- online travel service’s sale ratio travel services’ share of online sales
- precisely at
Why this response received Band 7.0
The report gives a clear overview and accurately covers the principal changes and percentages across all four retail sectors, which is its strongest feature. The main weakness is uneven language control, with awkward terms such as “sale ratio” and errors including “one-thirst” and “reached to.” Prioritise precise sector vocabulary and a final grammar-and-spelling check so the accurate comparisons are expressed cleanly.
IELTS Writing Criteria Scores
Task Achievement
The overview is clear, all four sectors are covered, and the key percentages and directions of change match the charts accurately.
Make the coverage fully explicit by stating the 2013 clothing figure and the exact size of the travel-services decline.
Coherence and Cohesion
Information follows a logical sequence from overview to 2003 details and then 2013 changes, with generally clear referencing and comparison.
Use distinct overview and detail paragraphs and replace the awkward transition “Reversely” with a direct contrast marker.
Lexical Resource
There is sufficient range for describing proportions and change, but several collocations and word forms are imprecise or incorrect.
Replace phrases such as “sale ratio” and “travel industries” with precise terms like “share of sales” and “travel sector.”
Grammatical Range and Accuracy
The response uses varied sentence structures with generally clear meaning, though article, verb-pattern, and punctuation errors appear repeatedly.
Correct forms such as “accounted for 22%,” “rose to,” and “one-third,” and remove unnecessary commas around linking clauses.
Write this task while it is fresh
Try the same task now. It helps you remember the feedback and write better next time.
IELTS Academic Writing Task 1
The pie charts below show the online sales for retail sectors in New Zealand in 2003 and 2013.
Your response
Write the task yourself, then compare your choices with the annotated response.